The yield curve inversion continuing to re-invert and the threat of broad tariffs are mounting an increasing amount of uncertainty for companies across virtually every industry.
During a similarly uncertain time at Capital One in 2015, we were so prepared for a potential recession that we had a strong confidence a recession would make us better off in the long run, by capturing a larger market share from competitors that were clearly over-leveraged.
Here are three essential goals that leaders of growing companies should focus on to turn this uncertainty into an opportunity:
⚖️ Optimize operations to bolster up margins
💲 Prioritize the P&L for financial health
📈 Define a strategic growth plan
Lets break this down--
⚖️
"𝐸𝑓𝑓𝑖𝑐𝑖𝑒𝑛𝑐𝑦 𝑖𝑠 𝑑𝑜𝑖𝑛𝑔 𝑡ℎ𝑖𝑛𝑔𝑠 𝑟𝑖𝑔ℎ𝑡; 𝑒𝑓𝑓𝑒𝑐𝑡𝑖𝑣𝑒𝑛𝑒𝑠𝑠 𝑖𝑠 𝑑𝑜𝑖𝑛𝑔 𝑡ℎ𝑒 𝑟𝑖𝑔ℎ𝑡 𝑡ℎ𝑖𝑛𝑔𝑠"
This should always be a top priority for any organization. With smooth operations that produce strong margins, a company gets traction fast, and stands out as a winner when the money stops flowing in the economy.
𝗦𝗠𝗔𝗥𝗧 𝗴𝗼𝗮𝗹𝘀:
1️⃣ Read Traction by Gino Wickman
2️⃣ Build a scorecard and select KPIs that are strongly tied to the P&L
3️⃣ Set goals for each KPI and keep responsible teams accountable for them
4️⃣ Each week, dig into the root cause of key performance and take away one action item for the following week to slowly iterate towards operational excellence
💲
"𝐶𝑎𝑠ℎ 𝑖𝑠 𝑘𝑖𝑛𝑔"
This is especially true when there's less cash flowing through local economies. Also, a recession tends to be followed with lower interest rates and stricter lending policies, so now would be a good time to pay down debt and improve credit worthiness.
𝗦𝗠𝗔𝗥𝗧 𝗴𝗼𝗮𝗹𝘀:
1️⃣ Optimize operations as a pre-requisite
2️⃣ Build a cash reserve of 6-12 months of operating expenses
3️⃣ Identify loans with the highest interest rates and increase payments
4️⃣ Create a cashflow plan and stress test it against best case and worst case scenarios
3. "Adversity is the chisel that carves out excellence".
With the first two goals in place, growth companies would be in a good position to expand. In a best case scenario, there is a strong financial position to invest in new product lines or double down on marketing. In a worst case scenario, there is a strong financial position to acquire struggling competitors or capture their market.
𝗦𝗠𝗔𝗥𝗧 𝗴𝗼𝗮𝗹𝘀:
1️⃣ Have the leadership team formulate a strategic growth plan under best and worst case scenarios
2️⃣ Identify a few leading indicators of how a slow down affects your industry. Automate measurement of these indicators with proactive alerts so you can respond quickly.
You may have noticed these goals weren't just about survival. They are about taking advantage of an opportunity.
Whether a business leader or employee, which of these three goals would you want your company to tackle first?
Have you ever wondered how big companies keep track of all their data and then actually use it to make decisions? Imagine owning thousands of books in a library without any shelves or labels, and you needed to know how many stories had a protagonist named "Matthew"—that would be very time consuming to answer, right? Large companies face a similar challenge with their data. That's where a data warehouse and analytical software come in! You can read more about how data improves outcomes for growing businesses here. But before you get started, you need to know: What is the true cost of building a modern data infrastructure in-house?
A complete data infrastructure will detail the complete journey of data from its raw state to the procured insight that is used to eventually drive business impact. This includes the transformation pipeline that moves data from its source to the target data warehouse, the actual data warehouse that houses all the data and enables users to query data to perform analyses and finally the visualization software that automates recurring reports via dashboards.
Each of four components outlined above usually live in different software. Additionally, they require a team of data architects and engineers to tie in all the pieces together and provide ongoing maintenance and support. The cost for each will depend significantly on which software you choose and how much data is involved. A typical all-in-cost for a mid-market company ranges from $25k-$500k per year for the software plus resources and an additional $400k-$800k for salary and benefits of a professional data team to support and maintain the solution.
That cost may seem high at first, and it is. Let's break it down to get a more true cost for a company like yours.
Transforming raw data from its original source (i.e. accounting software) to cleaned data in the target data warehouse happens through a transformation pipeline, often referred to as ETL, or Extract, Transform, Load.
Data sources can include business software (i.e. Quickbooks or other specialized accounting software), databases (i.e. PostgreSQL, MySQL or other database), Google Sheets, CSV uploads and even unstructured text data (PDFs, word documents, Notion, etc). See here for an ever growing list of data sources that Go Fig supports.
Go Fig offers a No-Code Workflow builder with plug-n-play functions to clean and transform data into a format that is useful and suitable for analysis and reporting. Datasets that are not clean can potentially be dangerous, resulting in errors that can lead to misguided decision-making that creates risk for the business. According to Gartner, such bad data cost companies an average of $15 million in lost revenue in 2017-- significantly more than costs of building a robust data infrastructure.
All-in Cost: between $5k to over $50k per year depending on the plan you choose and the volume of jobs. Many ETL solutions offer a variable pricing model that starts off with a free or low introductory rate, but scales up rapidly as you begin to use it more. This keeps you locked in on elevated prices that can jump unpredictably on any given month with particularly heavy usage.
To keep costs lower and predictable month to month, you may want to consider an ETL solution with a fixed pricing model that keeps rates consistent, and only increases when you choose a higher tiered plan.
Go Fig, for example, charges a fixed monthly or annual rate for unlimited workload for any of the tiered plans offered and only increases if you exceed the storage limit for each plan. This allows you to know exactly how much the plan will cost and you will have months to plan for a price hike, if at all.
A data warehouse is like a giant, super-organized library for a company's information. It stores post-transformed data from lots of places, like websites, sales records, and customer lists, and stores it all in one location. This is also the place where people in the company go to access their data for creating reports and doing analysis on company performance.
Companies can store data on their own servers (called on-premises) or using an external cloud-based solution. Deciding between on-premise vs cloud solution is wholly dependent on the company. On-premise requires physical storage space, upfront investment in time and resources, and ongoing maintenance, but they also give the company full control of their data.
All-in Cost:
Starting out, a company will likely find it more cost efficient with a cloud-based data warehouse. Once a company's data infrastructure reaches a peak stage of maturity, it could migrate its infrastructure to its own servers to obtain more cost savings.
All data warehousing solutions offer a platform for analysts to write SQL queries to pull the data they need to perform specific analyses, such as explaining the main drivers of recent sales trends or investigating an opportunity to improve marketing outcomes. This operation has typically been reserved for professional data analysts with a strong understanding of relational databases and technical experience writing code to get accurate data. With the advent of LLMs and AI, it has become possible for others to also query accurate data to answer such questions.
Go Fig is an example of a company that is leveraging LLMs like ChatGPT to equip C-Suite leaders and frontline employees alike with this analytics capability. Our proprietary Harvest-1 foundational model is built to understand the intent of each individual user and translates requests into a simple and understandable No-Code Workflow and Fig that can be validated or modified further.
Completing the chain of the data lifecycle are dashboards, which are elegant visual representations of the data prepared in a consumable format for humans to understand and digest insights from data so they can make informed decisions that drive the business forward. Data visualization software that prepare these dashboards are often referred to as Business Intelligence, or BI tools.
Without a dashboarding software, data that lives in a data warehouse can be pretty meaningless, so this software is a critical piece to the puzzle in order to get value from your investment in data. Analysis that depends on a human to manually query data and update a static excel spreadsheet, as valuable as that may be, is slow and time-consuming. With dashboards, any type of report or data manipulation you would perform in Excel could be available in a dashboard, updated every time the underlying data warehouse is updated. Imagine saving 2 hours every Monday from your intern who manually updates your weekly sales report, and having that same report updated every day of the week.
Extending beyond visualization, more advanced BI tools offer features to proactively monitor data and send alerts proactively. For example, Go Fig can send an alert when sales by 12pm on a particular day are below the acceptable threshold, signaling that there could be a severe issue with the sales team that requires your attention immediately. Creating an alert is simple, simply determine thresholds for a pre-defined metric, and we'll check it every time new data is pulled in!
All-in Cost: the average business intelligence solution costs $3k per year, but can cost upwards of $10k per year for more advanced solutions
As highlighted above, the cost of bad data is higher than the cost to build a robust data infrastructure. Building a team of qualified and experienced data and software professionals is critical to accomplish this goal. There are four main roles that are typically required to set up and maintain such a data infrastructure:
All-in Cost: the average salary for each of these roles exceeds $100k per year. Midmarket companies will require at least 1 of each role, for a minimum $400k per year but can likely reach up to $800k.
That being said, some of the more advanced software solutions can simplify the setup and maintenance of data infrastructure. Go Fig, for example, manages data storage for you, offers a simple, drag-and-drop ETL solution with a user-friendly visual interface, AI-powered analytics and dashboarding, as well as managed service add-ons. Choosing Go Fig as your all-in-one solution could potentially save you a lot on both software and staffing.
Let's look at some pretend companies to see how much a data warehouse might cost them.
Costs:
Software Cost: $9k (ETL) + $1k (data warehouse) + $3k (Visualization) = $13k per year
Total Cost: $13k per year
Estimated cost using Go Fig's Self-Service Premium plan: $4,500 per year (savings of $8,500!)
Costs:
Software Cost: $25k (ETL) + $20k (data warehouse) + $15k (Visualization) = $60k per year
Staffing Cost: four full-time data professional at $500k per year
Total Cost: $560k per year
Estimated cost using Go Fig's Enterprise plan with fractional data services: $285k per year (savings of $275k!)
As we can see above, the all-in cost of building a robust data solution can be steep, starting with $10k per year for just storage and software and easily exceeding $500k for larger companies who need to hire out a professional data team for more complex solutions. Companies choose to invest in data solutions, however, because the return is significantly higher than the cost:
Data infrastructure does not need to be as complex as it once was. Go Fig allows companies to bring their data warehouse, ETL and visualization solutions all in one place. Go Fig is a powerful platform that is simple to use, yet offers customizations you cannot find in other platforms. It is specific to your company and you, so you don't need to be overwhelmed by all the clutter.
It turns out that making it extremely simple for C-Suite leaders to centralize and access their own data, you can significantly reduce the cost of building and maintaining your own data infrastructure. Go figure! Schedule a demo today to see how Go Fig can work for your unique business needs and objectives.
With just 1:30 left on the clock in the 2002 Super Bowl, the New England Patriots were locked in a 17-17 tie against the powerhouse St. Louis Rams. The pressure was immense as Tom Brady, a relatively unknown quarterback at the time, took the field on his own 17-yard line with no timeouts remaining. Displaying immense resilience, Brady navigated the offense efficiently down the field while simultaneously managing the clock carefully, culminating in an opportunity for kicker Adam Vinatieri to kick a 48-yard field goal through the uprights to seal the W in a thrilling ending as time expired.
Tom Brady's brilliance isn't that he suddenly received inspiration to know how to lead an offense in those final 90 seconds on the biggest stage in sports. His brilliance instead is on how much work and focus he put into designing and practicing their 2 minute playbook before the season started and again before each and every game.
You might be wondering how does football tie back to business.
In some ways, the 60 minutes of a football game resembles the various stages of the economy. There are ups and downs, and external pressures that might put your company in a situation that you'd rather it not be in. Nevertheless you might find your company in that position, and so the next best thing is to prepare your team to win by creating and practicing a playbook that outlines the strategy and specific calls you will make, and lead your team to victory just like one of the most decorated team captains in sports.
As a business leader, you probably plan to run your business for a long time, in which it is likely to experience the full lifecycle of an economic cycle, which includes periods of good times (expansions) and periods of bad times (contractions or recessions).
Your curiosity may naturally try to figure out what part of the economic cycle we're in right now. After all, the Fed just decreased rates by 0.50% in response to unemployment increasing to 4.2% in August 2024, up from a healthy 3.4% we experienced in 2022. Jamie Dimon at JP Morgan recently made a prediction that we'll begin to see more economic deceleration in 2025 and on top of it all, economists agree that the global economy has been in the late-stage of the business cycle for the better of the last two years. Lower interest rates could take some of the pressure off, but the Fed may just be trying to play catch up after leaving rates high for too long, and it may already be too late.
We don't know for sure where we are and when the next recession might be, and trying to make any accurate predictions is a fool's errand.
What is important is that you do have a plan for when it does happen, so your company can thrive through it all. While less intuitive, the same is true for why you would want a playbook to build the strategy to thrive through a period of rapid expansion.
While it may seem intimidating at first, creating a cycle playbook is as simple as following 3 steps, outlined in the TAP framework below:
We'll follow these steps to create a sample playbook using an example with a fictitious company, LaunchMinds, a marketing agency that helps clients with running their digital marketing strategies.
Businesses exist to create a profit, and you'll want to have a good sense of what your key performance metrics look like that drive that profit. These key performance metrics will look differently in each industry, but what they all have in common is the following components:
Do you need help with identifying and measuring the right key performance metrics for your company? Before you hire a consultant, we recommend setting up your own data infrastructure. Read our full guide for a breakdown on the costs to implement data infrastructure for companies of various sizes.
For LaunchMinds, their key performance metrics might include the following:
Cost per Acquisition (CAC): $15,000
The total cost, including marketing and sales costs, to acquire a single customer. Since professional services companies are consultants who take fewer and higher value clients, it is not too surprising for a company like LaunchMinds to spend as much as $15,000 to acquire a customer.
Acquisition Cost Payback: 3 months
The duration it takes for a new client acquisition to pay back the total costs of acquiring that customer. If LaunchMinds spent $15,000 to acquire a customer that adds $10,000 revenue per month with a 50% margin, then it would take 3 months for that customer to payoff the total costs of acquiring that customer.
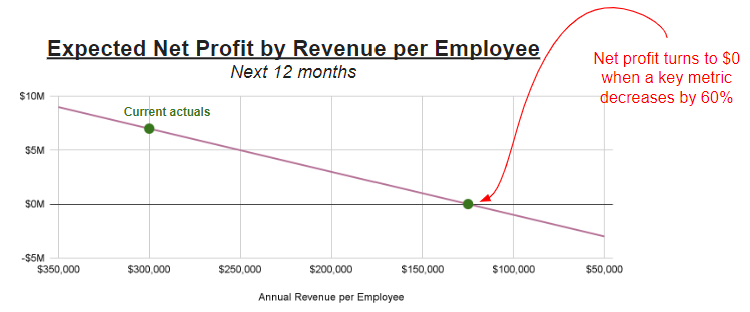
Annual Profit per Employee: $300,000
Total annual profit divided by the number of employees working at the firm. This represents the value that each employee adds to the business.
Now lets stress test the company. The exercise of "stress testing" is to stress components of the aforementioned key metrics to see at what point company profit falls to its breakeven point. We'll start with two immediate observations of how LaunchMinds could go from a profitable to unprofitable business in a short period of time:
First, their acquisition costs are very high, such that they do not breakeven until 3 months after acquiring a new customer. If the customer stays with the firm for 12 months, then 9 months are adding value. If the average duration of a client gets cut in half to just 6 months, then the profit added from that client would decrease by 67%! If the average duration of a client falls to 3 months, then LaunchMinds would not make a profit at all. In other words, LaunchMinds is resilient to a decrease in duration of a customer up to 75%.
Secondly, the annual profit per employee is quite strong at $300,000. If the company experiences customers churning and a tougher time acquiring newer customers, this number could gets dangerously close to the breakeven point as well. If we plotted LaunchMinds profit per employee by decreases in client acquisition, we would see that Launchminds would become unprofitable if the total number of clients drop by 60%.
Once you've identified your key metrics and stressed them to the point of breakeven profitability, you will have a better idea of what needs to be done today to increase your resilience to external stressors. In general, you'd like to button up the business to reduce exposure to the biggest points of failure, and diversify on your key vulnerabilities.
"People think focus means saying yes to the thing you've got to focus on. But that's not what it means at all. It means saying no to the hundred other good ideas that there are. You have to pick carefully. I'm actually as proud of the things we haven't done as the things I have done. Innovation is saying no to 1,000 things."
Steve Jobs
By focusing on what your company does exceptionally well, and saying no to the other good ideas, you are able to create an extremely compelling value proposition to your customers externally, and can create an extremely efficient operation internally. Ask your best 2-3 customers why they chose to work with you. If they say "you're the most reputable marketing agency serving the manufacturing industry in the southeast," then you can get a pretty good sense on what they want you to continue focusing on-- manufacturing and the southeast. It might be a good idea to decline the temptation to expand to a different industry or geography unless you've already captured the majority of the market share in those segments of the market.
Working Capital is the amount of money you have in your cash balance today, and excludes how much you expect to get paid tomorrow from an Account. Contracts with your clients may offer a payment plan that allows the client to pay after work has been done. This constitutes your Account Receivables in accounting. This is money that you might not ever actually see, in the scenario where a client runs out of money or goes bankrupt before they can pay you back in a scenario of widespread financial distress in the economy.
Work with your CPA to do an audit of your existing contracts and your financial KPIs (key performance indicators) like Weekly Net Cash Flow and Current Ratio. Make an assessment of the impact to your own company's solvency if you had to charge off your 2-3 largest accounts.
If this scenario looks bleak, you have a few options to optimize your working capital:
At the end of the day, the most important thing is to look at the numbers and address anything that surprises you (disclaimer: you will most certainly find a few surprises, including wasteful expenses you did not approve). Work with your FP&A team to do a deep dive to find more ways to increase your working capital.
Don't put all your eggs in one basket, as the saying goes. In your business, this can be represented in a few ways:

For the first two questions, diversification is quite simple-- don't get too comfortable with a business that relies on a few good clients and a few good suppliers. Make it a priority to acquire more larger clients and negotiate multiple suppliers. When it comes to the last question, however, there is a fine balance to walk between focus and diversification.
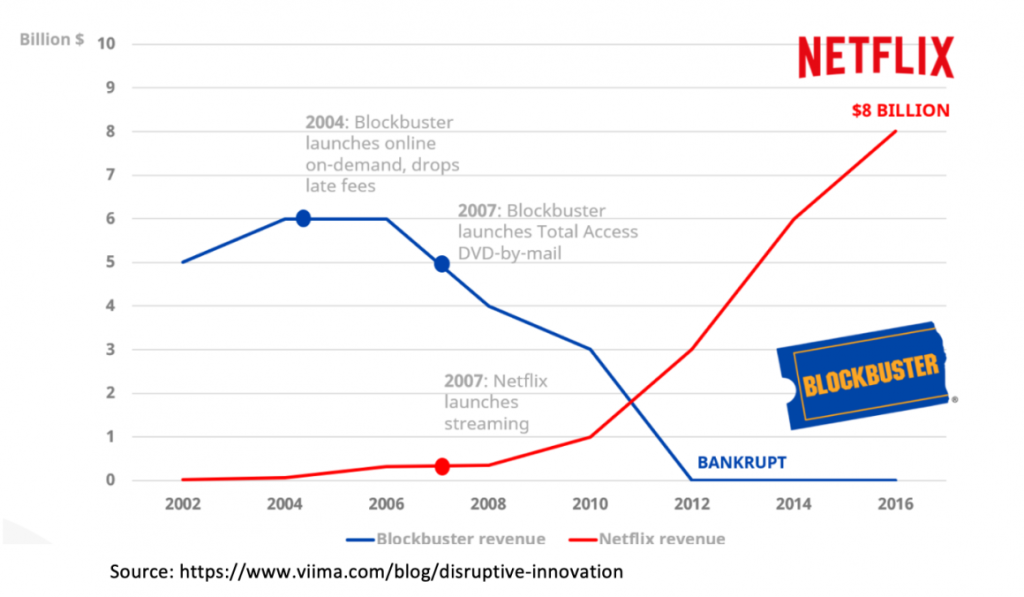
Focusing on one product allows you to be exceptional at delivering value efficiently to customers. But it only works until it doesn't. Never forget the iconic example of Blockbuster. I remember walking the aisles with my siblings on a Friday afternoon in the early 2000's, picking out a movie and snacks for family night, and we loved it despite the price and the inconvenience. Believe it or not, the leaders at Blockbuster turned down a chance to purchase Netflix for $50 million in 2000. We all know what happens next--Netflix leaned into modern technologies while Blockbuster simply kept doing what used to work well for them, and now our family night experience is convenient, inexpensive, and ridden of late fees, and Blockbuster simply does not exist. They went from generating $6 billion annual revenue in 2004 to filing for bankruptcy 8 years later, and Netflix continued to grow to $36 billion annual revenue in 2024.
I recommend re-evaluating your business strategy every 6-12 months. Assess what is going well and genuinely listen to your customers' complaints about what they dislike about your product or service. If customers are leaving to a competitor, give them a call to understand why. Work with the team to identify how you could make your offering even better. Lean into incremental improvements that make sense to incorporate to be continue being a dominant leader in your space.
Once you have stress tested your KPIs and addressed (or created a plan to address) the biggest points of failure in your business, you now have the full context to build your playbook. Don't feel the need to do this all alone. Often times you'll receive the most value from frontline employees who have a deep understanding of the specific vulnerabilities your company is experiencing, and equipped with the right tools, they can help you solve these challenges for you.
Determine what you will stop, start and continue doing in response to a change in the economic environment, namely at the start of a contraction period as well at the start of an expansion period.
For example, at the start of a contraction period, LaunchMinds would respond by 1) stop spending on long-term investments on market research that isn't expected to generate revenue for 18 months, 2) start offering a loyalty program with discounts to existing customers, as well as expanding referral bonuses, and 3) continue focusing on its core marketing service to their specific industry and geography.
Get started with applying the TAP framework and building your business resilience playbook.
Need a jumpstart? Get access to our free template using the form below!
Go Fig was recognized as a finalist for the 2024 South Carolina InnoVision Awards for having advanced innovation and technology and making significant contributions to the state of South Carolina.
The world just changed....again. It seems like every 6 months, a new upgraded version of ChatGPT is released and completely changes the game. This happened again last week with the release of OpenAI's GPT-4o model, which brings all the punch of the GPT-4 model, without giving up cost or speed.
While this disruption may appear scary, don't fret. Look around-- 83% of your peers are not using ChatGPT consistently at work. People are uncomfortable with change by nature, and the thought of a machine overlord is admittedly frightening. However, when we set aside the irrational fear, you wake up to the realization that there is a major opportunity here. If only 30% of your peers are using ChatGPT, that means that by taking advantage of this technology early, you can accelerate your career by 2-3x'ing what other people do. And if you're a young professional who just started out, using GPT-4o effectively is like a rocket booster to standing out and exceeding in your role, especially within a small company or small team within a larger company that cannot afford the cost of advanced data tools.
So how can you take advantage of the benefits of GPT4o? This article delves into what makes GPT-4o so special and how you can use it to take advantage of it. ChatGPT has become an indispensable tool for many.
One of the standout features of GPT-4o is its turnkey nature and extreme customizability. For young professionals who may not have extensive technical backgrounds, this is a significant advantage. The minimal setup required means you can start getting valuable output almost immediately. Whether it's generating marketing copy, analyzing customer feedback, or creating data-driven reports with ChatGPT, GPT-4o adapts to your needs with ease.
Another groundbreaking feature is its expanded context window of 128k tokens. This means GPT-4o can handle much larger sets of information at once, providing deeper and more comprehensive insights. For marketers using ChatGPT, this translates to more detailed customer profiles, better understanding of market trends, and more effective targeting strategies. The ability to process and analyze large volumes of data quickly allows for more informed decision-making, helping you stay ahead of the competition.
In today’s dynamic business environment, taking days or even hours to collect accurate information can feel like you're trying to walk to the mailbox after a heavy snowstorm. It should be so easy, and you can't get to what really matters because it takes forever to get through all the powder! GPT-4o offers real-time data analysis, delivering immediate insights that empower you to make quick, informed decisions. This capability is particularly beneficial for marketing campaigns, where timing can make or break your success. The immediate feedback loop provided by ChatGPT allows for rapid adjustments, ensuring your strategies are always optimized for maximum impact.
GPT-4o's ability to understand and generate data-driven reports significantly improves the efficiency and accuracy of your data operations. By automating repetitive tasks such as data entry (heaven forbid we ever need to do this again), data manipulation in spreadsheets (vlookups anyone?) and basic analysis, you can free up valuable time to focus on strategic initiatives. This not only boosts productivity but also enhances the accuracy of your data, leading to more reliable insights and better business outcomes with the help of ChatGPT.
The AI can provide sophisticated business strategies and solutions, tailored to your specific needs. Here are two examples of how GPT-4o serves as a powerful consulting tool that can drive incremental value to your employer's bottom line:
Our team here at Go Fig AI has been absolutely floored by the things that GPT-4o can do. It has been able to perform a broad array of exploratory analysis and deliver insights with just about every dataset and problem we gave it. It's like a real-time senior data scientist on the team who is available for everyone 24/7, and it just keeps getting better with the more information we fed it!
Where we once thought we were setting the standard for data analytics in our own careers, that is no longer the truth. GPT-4o just changed the game for our roles in enterprises, and it will certainly change the roles of everyone who uses data in businesses of all sizes with the help of ChatGPT. Imagine having the power of enterprise-level analytics in your team, company, and even your personal life! Try it for yourself-- connect your business software with Go Fig AI, and play around with what hidden opportunities you can uncover, or insights on your marketing strategies you can optimize, or solutions to financial challenges you can solve for. Who knows!?
There's only one thing we can know for certain: this technology is going to continue to advance rapidly and continue to change how business is done in all our roles. By embracing the technology, we become the first members of the new generation of AI-equipped professionals, and we will excel beyond the capabilities of those who prefer to pretend ChatGPT doesn't exist.
Have you ever wondered why you're having a slow day on a Friday night? The weather is great, you just released a fresh batch of a new beer, and you even sent out an Instagram post with tonight's specials, but as you're standing behind the bar you begin to wonder if you should have entered into this expensive hobby in the first place. You day dream about the last time your tap room was a thriving full house and the thousands in sales you made that night made you feel like you made it! You wonder what you did right, and why tonight is so different. Perhaps the answer lies in customer segmentation. If only you could replicate your success so that every Friday night was that night. Picture the satisfied smiles, clinking glasses, and the satisfying hum of conversations blending with the mellow music. Imagine being able to pay yourself a fat paycheck every month, and you could sleep well knowing you could wake up tomorrow and keep brewing. What a dream that would be!
But it doesn't have to stay a dream. We can turn that dream into reality, simply by understanding what components went right on the good day and replicating that success again and again. To do this, we'll lean on analytics to identify your best customers, and find ways to continue to engage and foster customer loyalty through marketing, events and your menu. If this task feels dauting, you may want to read our guide to leverage AI to support you as a business consultant with a one time cost of $1.

You know your regulars: there's Jim, Dale, and Sean. You know what they like to eat and drink, and you can expect them right to the minute. But what about the rest of your customers? Who's that guy wearing the green hat and skinny jeans? What drew him in to your brewery tonight? Does he love the beer and vibes you offer, so much so that you start seeing him every month? If so, you might begin to wonder if there more versions of that customer around town that don't know about you yet.
A Customer Segmentation Analysis is the process of grouping similar customers together into different groups. Common traits to group customers include geographic, demographic, psychographic, and behavioral traits. Having well defined segments will allow a business owner to research the local market size for each group, plan to brew the beer and update the venue to cater to the primary segments that promise the most lucrative opportunity, and develop a strategy to grow these segments via marketing and events. To help explain this in more detail, let's imagine a fictional brewery named Yeasty Brews. This brewery sits in an urban neighborhood near multiple colleges and universities, office buildings where young professionals work, and popular venues for live music. They serve a variety of craft beers that caters to a broad audience. An example of their customer segments might look like the following:
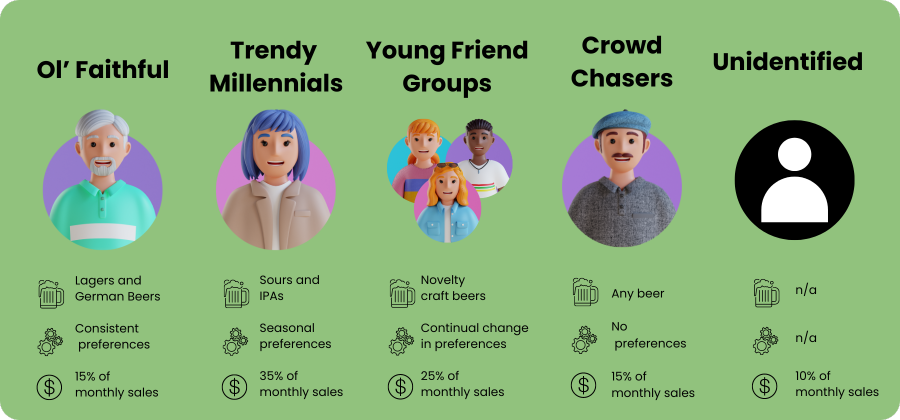
Men above the age of 40 who like to wind down during early happy hour before heading home to the family. They wear professional attire and drink mostly lagers and German beers, usually just one and never more than two. They come consistently, rain or shine, and whether or not you have an event, although they prefer the less busy times without events. This group makes up 15% of monthly sales.
Millennials in the age range between 30-45 who are married with kids. They don't come as frequently, but are consistent nonetheless. They have the highest average ticket of any other segment and when they're in the room, you can feel the party. They respond well to social media posts, are signed up to your loyalty programs (such as Arryved Loyalty), and plan their visit during specials, promotions, and events. They like to order the more trendy beers, which currently might be sours and IPAs, but their preferences change with the season and year, and its a process of constant learning to see what's working now. This group makes up 35% of monthly sales.
Mostly college and recently graduated students in the age range between 21-28 who are single and go out in larger groups. They don't stay long, because they like the appeal and novelty of bar hopping. They make sure the brewery is on their agenda for the evening because they love the new and creative flavors they don't get anywhere else, like the Mocha Stout and Chili Kolsch. This group makes up 15% of monthly sales.
Novelty seeking customers who follow social media and show up for big events where they expect a large showing for the energy and vibes. They like to come when they see a lot of people at the brewery, and they tend to order anything on the menu. While they're nice to have, its incredibly hard to predict when they come and near impossible to directly get them in the door. This group makes up 15% of monthly sales.
We are probably not able to identify every single group of customers, so we'll save a catch-all group for the remaining unidentified customers. Because their interests or tastes are spread out, its hard to know exactly what they like or why they come. We'll continue to do some research on this group as we gather more data. This group makes up 10% of monthly sales.
Once these segments are well defined, a brewery can create an action plan to turn those slow Friday nights into very busy nights. There are four primary levers: menu, space, event calendar, and marketing. Notice that we didn't include pricing as a lever. This is because by focusing on maximizing the experience for a brewery's best-fit customer, a brewery will be able to charge a premium for the craft beers on their menu. Remember that a brewery is a for-profit business, and discounts on craft beer doesn't help to keep the lights on.
In our example above, the different segments ordered different types of beer and had varying preferences in how frequently their preferences changed. Additionally, we found that total sales were different for each of these groups. As a result, the proportion of beers on your menu should roughly match the proportion of sales of the groups that reveal their preferences. In our example, Ol' Faithful, Trendy Millennials, and Young Friend Groups show a strong preference for categories of beer. For this brewery, we would want to have 20% of the menu to represent lagers and German beers, ~50% of beers to be sours and IPAs, and 30% of the menu to be novelty craft beers.
It is very important to keep track of sales by these segments and beer types on a monthly or even weekly basis. As soon as you notice any meaningful inflection in sales from a particular segment, you need to update your menu accordingly. For example, if you notice fewer sales coming from your loyal trendy millennial group, it could be because the changing of seasons means they're not interested in sours anymore. Maybe they've caught on to a new beer that a neighboring brewery started to offer and are going there instead. Keep close tabs on what these customers are asking for, either through casual conversations, surveys to customers directly via Email, or polls on Instagram on what beer they might want you to make next. Consider making small batches of new beers you see gaining popularity from other breweries posting on Instagram and offer them as a "limited special". If the small batch flies off the shelf, schedule it for your next production batch. If its hard to sell, toss it and try something else!
On the other hand, if you are finding success among Young Friend Groups, consider doubling down on this segment. Increase the proportion of novelty craft beers on your menu. Continually test out new and interestingly weird flavors that piques the interest of this segment. You may find that your entire brewery's business model begins to pivot to this new segment, and that's perfect-- you can continue to foster this niche!
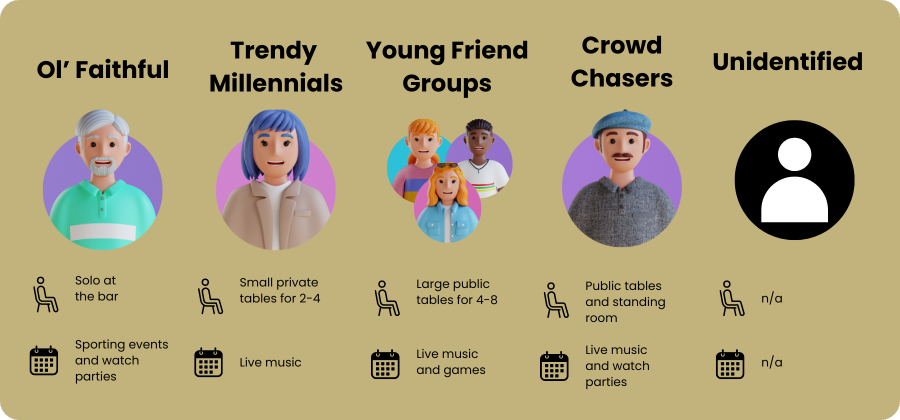
Similar to the menu offering above, we want to make sure that the spaces is creating the vibes that is expected of our customer groups. Taproom space boils down to the bar, small tables, and large tables; TV or no TV; indoor vs outdoor. The primary consideration here is to notice what type of space reaches capacity first. Our example brewery will want to prioritize space for the segments that drive the most sales, which includes smaller private tables for Trendy Millennials and bar seating for Ol' Faithful. That being said, if a large group of friends can't find a spot for their group to sit during a busy time, they may opt to go somewhere else, even if there are two smaller tables available, whereas Millennials can still sit at a large table if the smaller private tables fill up. So when in doubt, get more bigger tables than you think you'll need. But in reality, this may take some trial and error, and constant adjusting with the season and as your business finds growth with a singular customer segment over another.
Second to your menu, events are the lifeblood of your brewery. Get as creative as you do with beer-- events can include holiday events for every season, synergistic promotions with food trucks and other businesses, live music from bands and DJs, games like trivia and music bingo, and watch parties of local sports teams and other sports. It's a good idea to test out a broad variety of events to start out with. When you do this, keep close tabs on how much sales increases across each customer segment as a result of the event. For example, you might find that watch parties greatly appeal with Ol' Faithfuls and Young Friend Groups, but less with Trendy Millennials. Additionally, you might find that live EDM music tends to attract the Trendy Millennial crowd, and less with the other customer segments. You might be tempted to just keep doing both. But these events aren't always free, so you'll need to calculate what is the incremental profit.
| Event | Cost to Host Event | Actual Sales | Net Return from Event |
| No Event | n/a | $4,000 | n/a |
| March Madness Watch Party | $0 | $4,500 | +$500 |
| Live EDM Music | $500 | $6,000 | +$1,500 |
| Music Bingo | $200 | $5,000 | +$800 |
Let's assume that our example brewery tried out multiple events. They consistently generate $4,000 in sales on a typical Friday night, so they can evaluate how much more Sales were generated by the event alone. In this example, the March Madness watch party generated $500 more than expected, while live EDM music generated $2,000 more than expected. Why is this? It could be because this event appealed to Ol' Faithful and Young Friend Groups, the two segments who were most likely to show up for a beer that night with or without the event. Live EDM music, however, saw a huge increase across the Trendy Millennials. Many of your customers in this segment changed their plans to visit your brewery instead of somewhere else because of the event offering. And even though Live EDM music cost more than a watch party, it still paid off because the net return after accounting for the cost of the event was highest compared to the cheaper events. If you notice a big lift in sales from a particular customer segment like this, keep doing what works. By fostering customer loyalty in a particular segment, you'll begin to grow this segment and increase the frequency of repeat customers as well, a double score!
The last thing to remember is to continue innovating on your event offerings. Remember that preferences get stale, and even your most consistent customers seek novelty from time to time. Keep trying out new events to appeal to your largest customer segments, and track what is getting you new customers and more incremental sales above what you would have expected from a non-event night.
Finally, we've saved the best for last! Okay, we know, nobody likes marketing. Well, we do. Marketing is important. It is the engine that keeps your customers engaged when they leave your brewery for the night and keeps them wanting more so they come visit you again the next chance they get. It is the engine that draws in new customers who are similar to your loyal customers but may not yet know how much they will enjoy your beer and venue. Without this engine, it is difficult to maintain month over month sales, and impossible to grow sales year over year.
If you've done marketing before, you will have noticed that it is expensive. Breweries do not have the marketing budget to blast a promotion out to the entire city and get as many people in the door as possible. Even if they did, that would be a bad business decision. You might be paying for ads that draw in people who don't actually like your menu or space, and they will never come back for a repeat visit.
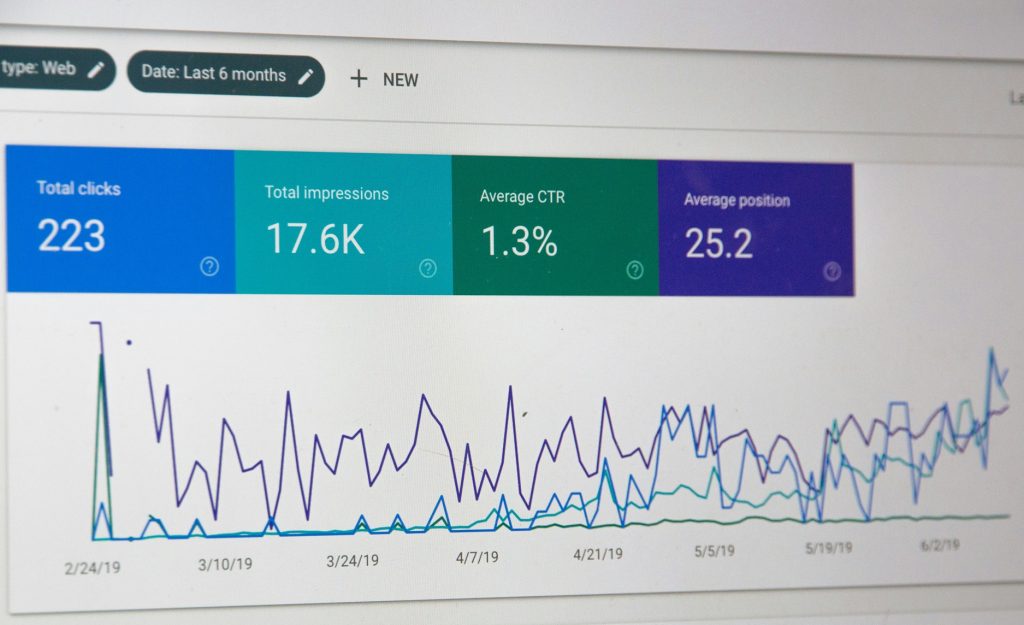
This is where having well defined customer segments is crucial-- with these segments, you will be able to be incredibly specific with marketing to your best-fit customers. When promoting a new beer, for example, you will already know that you need to promote the beer to the customer group that likes that type of beer, i.e. a sour promotion should target Trendy Millennials. Same for events and spaces. Social media platforms allow you to perform "look-alike" marketing, where you can take the email addresses of specific customer segments from your email list or loyalty program and get a sample of customers that have a similar demographic, similar interests, and even have mutual social connections with your existing customers in a particular segment. By doing this for each of your defined segments, you will be able to get the right messaging to the right people, keeping marketing costs down, and marketing effectiveness high.
The ratio of higher sales resulting from marketing to marketing costs is known as marketing efficiency. The higher the marketing efficiency, the more you are getting out of each $1 of marketing spend. Be sure to calculate marketing efficiency by each of the segments you are targeting in your recurring analysis. Again, breweries should constantly be innovating and trying new things with what and how they market, and double down on what works best to increase loyal customers and grow sales consistently.
Nathan Freystaetter, founder of Go Fig, participated in Furman University's GVL Starts, a 9-week long program hosted by the Hill Institute of Innovation and Entrepreneurship. The program consisted of mentorship from professionals across a broad range of expertise, pitch practice, and comradery from other startup founders. The program culminated in the highly anticipated GVL Starts Demo Day, a pitch competition in front of a crowd of over 200 people and 3 judges, including Shay Houser of Founderville VC.
Three startups received a $5,000 grant-- one for Best Product or Service, Best Technology, and Crowd Favorite.
The judges announced Go Fig as the winner of the Best Technology startup and took home a big check worth $5,000!
As a business owner, you and I have seen peers in our communities that have sadly gone under. Maybe a competitor opened up that took all their business. Maybe the apparent recession has been dampening sales for quite some time. Or maybe they took out too big a loan that they couldn’t pay back and the bank came knocking. Consulting with a business consultant could have helped avoid these pitfalls. Whatever it is, it is a huge loss for the business community and the local economy— this happened last month to Birds Fly South, a hometown favorite brewery in Greenville, SC.
As businesses grow, the need for strategic guidance becomes crucial, for managing cashflows efficiently and driving new business growth. However, engaging a business consultant or fractional CFO to help with strategic decision-making can be costly, making it impractical for many businesses already trying to scrape by.
While there are a few existing products that can serve as a virtual AI consultant, they are either lacking functionality or overpriced, or both…And business owners I know who are using these products are still spending 10+ hours per week doing their own analysis by exporting their data into excel! That’s insane.
But then in November 2022, who walks in but OpenAI with ChatGPT, a revolutionary technology that can aggregate all the information online into a simple chatbot interface. Then 12 months later, OpenAI announced a new feature to create your own GPT! And just like that, for less than $1, you can harness the expertise of a tailored business consultant. Keep reading to discover how to get started with your own virtual AI consultant.
In its announcement last month, OpenAI introduced GPTs, “a new way for anyone to create a tailored version of ChatGPT to be more helpful in their daily life, at specific tasks, at work, or at home — and then share that creation with others”. The GPT Store, which was just launched, consists of ready to go plugins you can use if you are subscribed to ChatGPT Plus, which comes with a $20/month subscription fee. It is still very new, and the current offerings are extremely limited.
Assistants, on the other hand, are simpler versions of GPTs that cannot be shared. You need to create them from scratch, but they come with the free version of OpenAI, are still fully customizable, and are pay as you go. For our use case, we’ll opt to make an OpenAI Assistant.
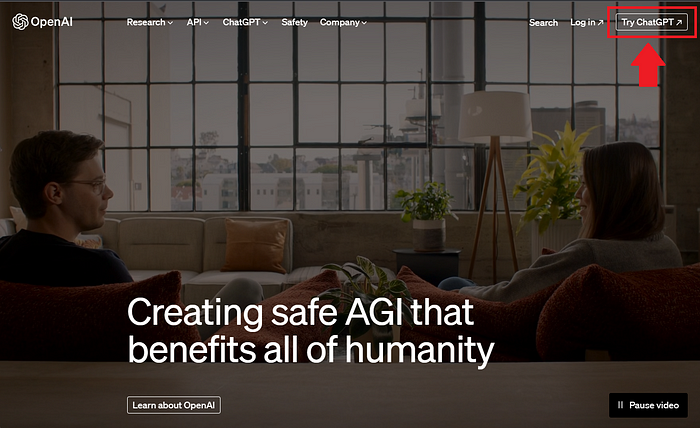
To setup your account, navigate to www.openai.com and select “Try ChatGPT”.
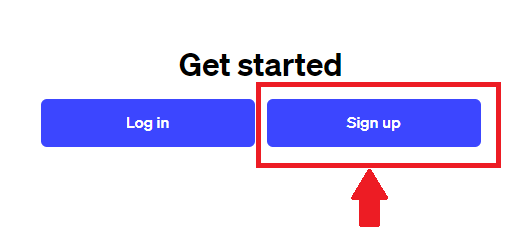
Under “Get Started”, select “Sign up”
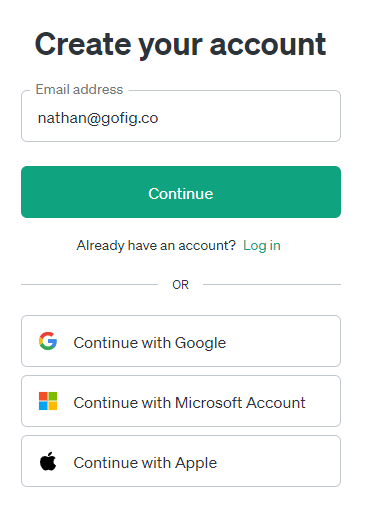
Complete the form to create an account with your email or sign in with social Oauth. Follow all the steps to get signed up. It may ask you to validate your email address.
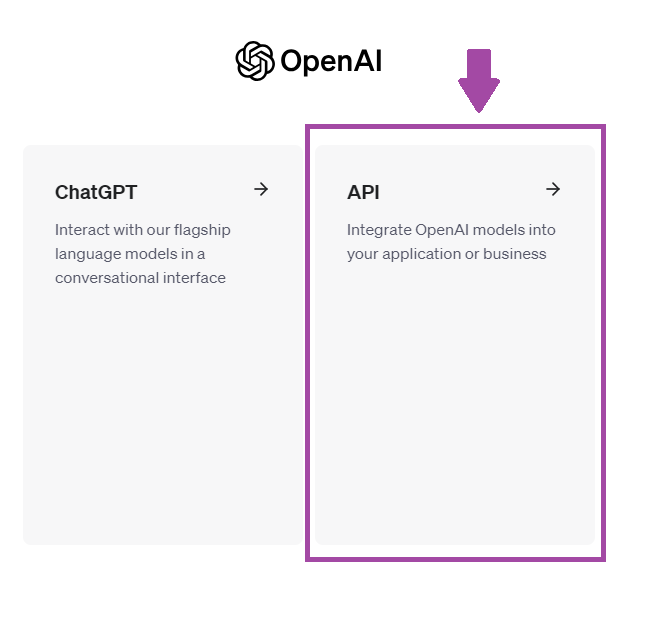
Once logged in, avoid the temptation to go right to ChatGPT. To build an Assistant, select “API”. Don’t worry, no coding is necessary.
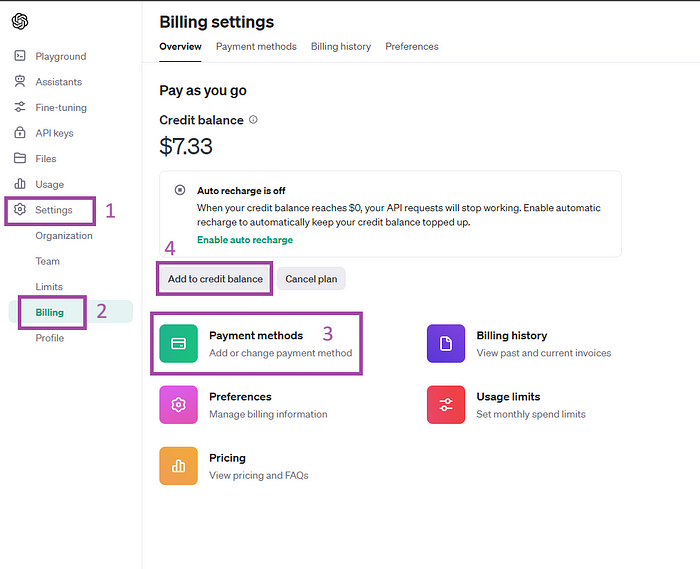
Finally, we’ll need to add a payment method to get started. Navigate to the left panel, select “Settings”, then “Billing”, then “Payment methods” to add a credit card number, and finally “Add to credit balance” to add your first $10.
Don’t worry, it's only pay as you go. I added my first $10 about 3 months ago, and I still have a balance of $7.33 after moderate use.
There you go, you’re all set up! Now we can build our Assistant!
We’re going to start by building a basic Assistant. To do this, navigate to the left side panel and select “Assistants”. In the screenshot below, you will see I’ve already made quite a few assistants. To create a new one, let’s select “+ Create”.

There are only three pieces of information that are needed here: 1) a name for this assistant, 2) instructions for your assistant, and 3) make a selection from the drop down of the specific model you want to run.
In the example below, I created an Assistant named “Restaurant CoPilot”. I wanted this Assistant to give me tailored advice for the Beehive Waffle Company, a boutique waffle shop I used to run.
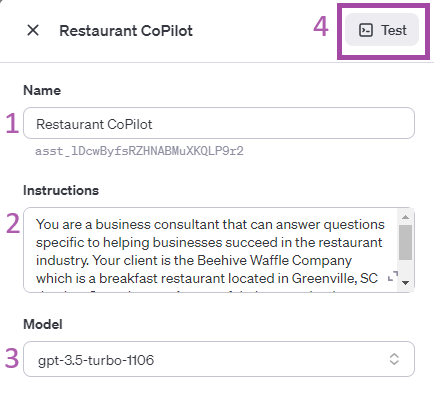
The instructions I gave the bot was “You are a business consultant that can answer questions specific to helping businesses succeed in the restaurant industry. Your client is the Beehive Waffle Company which is a breakfast restaurant located in Greenville, SC that has 3 employees.”
Finally, I selected the “gpt-3.5-turbo-1106” model. It is the second to best model that OpenAI currently offers, but the number one best, “gpt-4” is significantly more expensive (~9 cents vs 0.3 cents per query).
We are now ready to test the Assistant. Select “Save” and then “Test”. To test your assistant, you can ask it any question you might have. To most effectively work with an AI chatbot, what I found best is to ask questions in multiple smaller steps using the D3F framework:
Define and 3x Focus (D3F) Framework:
a. Define your goal
b. Focus on one specific topic
c. Focus on one specific analysis
d. Focus on one specific recommendation
Define your goal
Let’s start with the goal that most small business owners cares about, your cashflows: “What are some ways I can increase my net cashflows to my goal of $10,000 per month?”
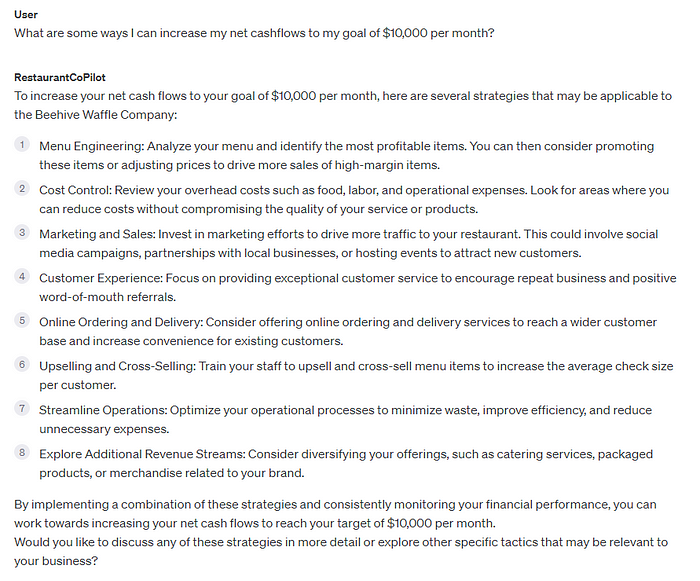
As you can see, my assistant gave me a good selection of ideas to work with. Some are more obvious that I had thought about, like Menu Engineering and Marketing. There are others that are less enjoyable to think about, like Cost Control and Sales. Then there are others that are brilliant ideas, like Streamline Operations and diversifying into packaged products (maybe a Beehive branded waffle mix!!)
Focus on one specific topic
Our Assistant will also have memory. This means we can ask it a follow-up question on a specific topic from the previous answer without the need to type everything up again. In this example, I followed up with “Can you be more specific about the ‘Cost Control’ strategy?”
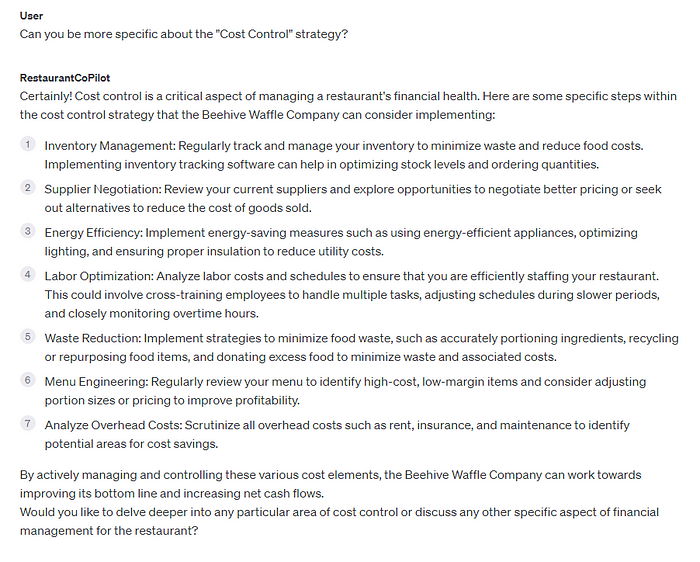
This answer is a goldmine! There are so many great ideas here to get me started with ways to cut costs to improve profit margins for the Beehive Waffle Company, like Menu Engineering to identify the high-cost, low-margin items, evaluating portion sizes, and scrutinize all overhead costs. And the AI chatbot even followed up with asking me if I wanted to dive even deeper. So we shall.
Focus on one specific analysis
We’re going to ask our Assistant to probe even deeper on one specific analysis: “Yes. Could you delve deeper into how I can identify high-cost, low-margin items in my menu?”
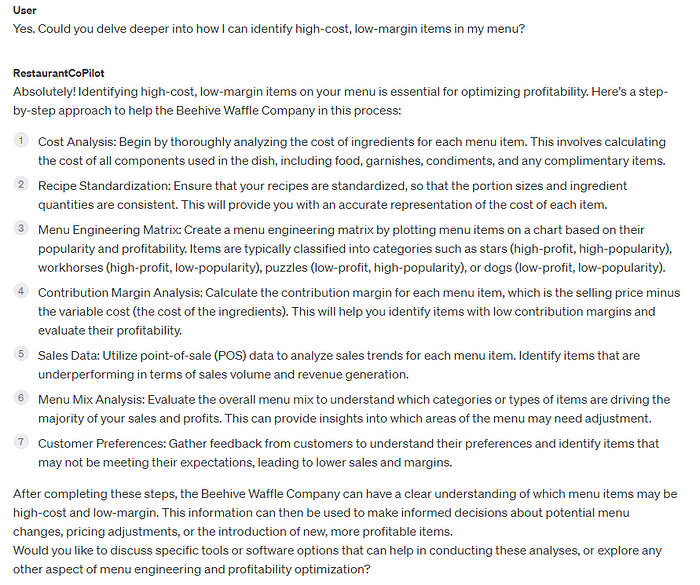
This is nothing short of amazing. My Assistant is giving me a list of analyses I can take to understand my product offering and identify opportunities to analyze it. You might be looking at this and telling yourself there’s no way you’re going to have the time to do this analysis yourself. You’re just going to suck it up and pay the $20k to the business consultant or fractional CFO, or just roll the dice and hope for the best.
But wait…
This is just the basic Assistant, and we still have one more “Focus” query to ask. But before we can do that, we’re going to need to turn up the functionality of our Assistant.
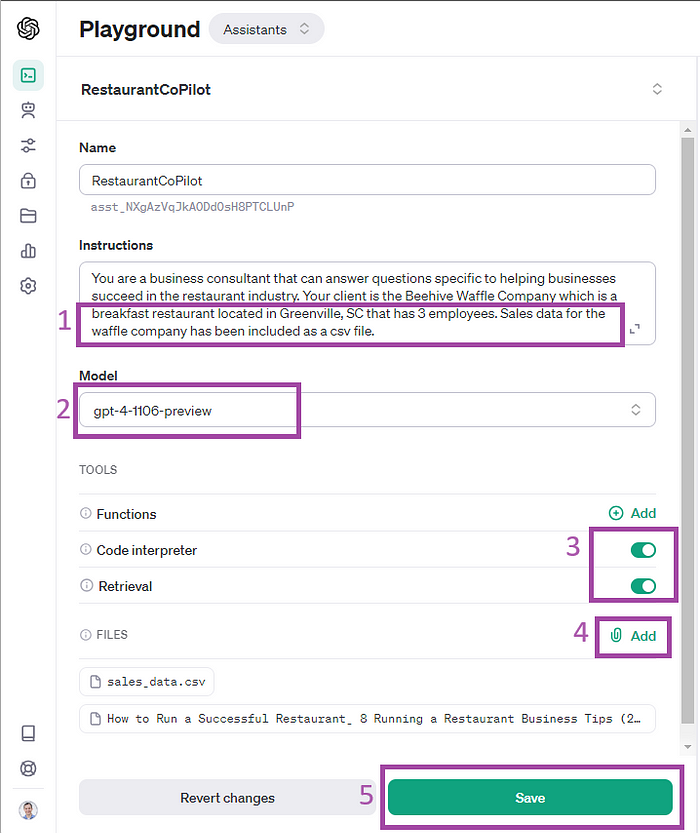
To accomplish this, we’re going to make a few changes to the left side of this screen.
1- I’ve added a line in the instructions to inform the model that we will be including our sales data as a csv file. With this information, the Assistant will know that if we ask a question about our sales data, that it will need to query our data before it can provide an answer.
2- Upgrade the model to the more powerful and more expensive gpt-4 model. Note that “gpt-4–1106-preview” is a third the price of “gpt-4”
3- Toggle on the switches for Code Interpreter (which allows the Assistant to generate code to query our dataset) and Retrieval (which tells the Assistant to retrieve information from the files we will upload).
4- Add two files: a copy of the Beehive Waffle Company’s sales data and a copy of an article from Toast titled “8 Tips to Running a Successful Restaurant”. This gives it the ability to query off our data while simultaneously employing the tips from Toast.
5- Select “Save”
And here is a sample of what the Sales data looks like. This was a csv file I downloaded from my QuickBooks Online (QBO) account, and I made a few modifications to it. It is a product-transaction-level view of all the sales generated by Beehive. Notice that I added a column named “cogs” which stands for the Cost of Goods Sold for the product we sold. This will enable our Assistant to be able to assess the profitability of each of our products, which we’ll ask it to do next.
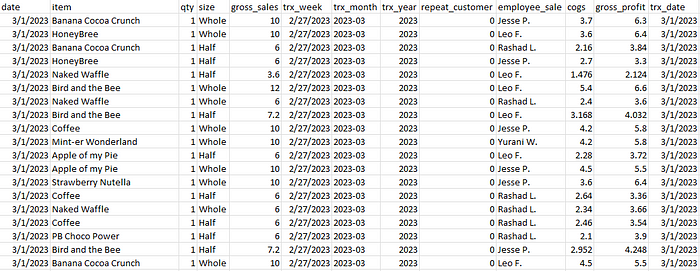
With this information saved, we can get back to testing the Assistant.
Focus on one specific recommendation
Finally, lets ask the last Focus query. I’m going to ask the Assistant to perform one of the analyses to get some actionable recommendations for the Beehive Waffle Company: “Can you create a Menu Engineering Matrix for each of our items?”
At first, it looks like my hopes may get disappointed as my Assistant encountered an error.
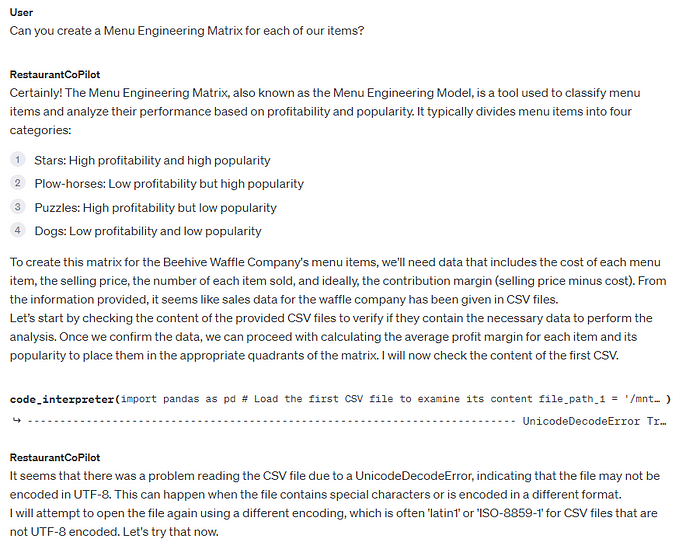
But as it turns out, our Assistant thought the Toast article was our data. Classical clerical error. Happens all the time. They did verify they were able to eventually find my dataset and even summarized each of the column names nicely. Nice due diligence, Assistant!
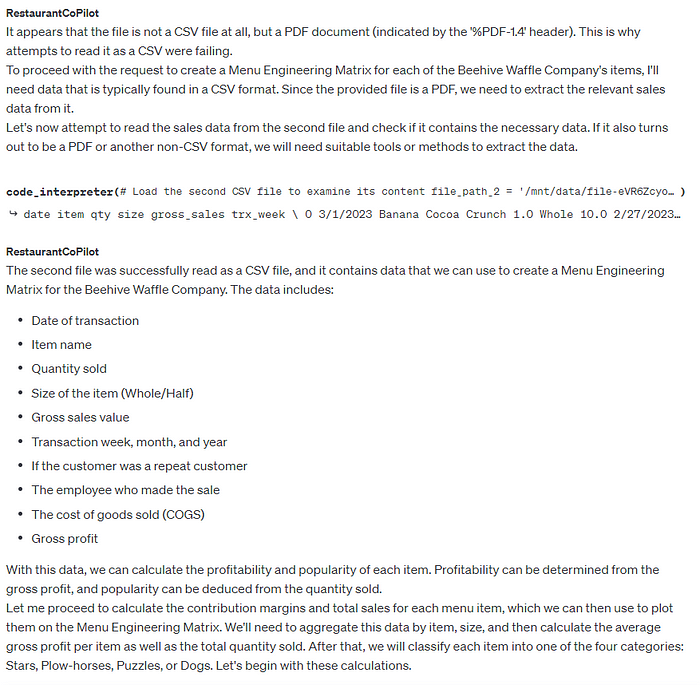
Now the anticipation builds as I wait to see the analysis of my business sales and be empowered with AI-powered insights!
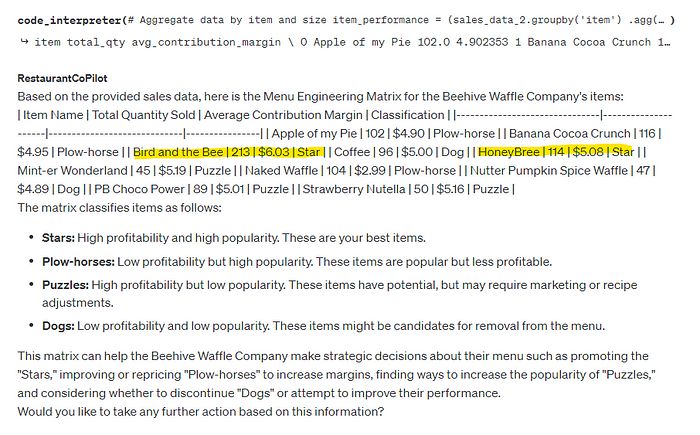
Would you look at that! The analysis has been complete! Formatting isn’t great here so I added some highlighter action. What’s most important is the numbers are solidly accurate and is our first step to making a data-driven decision on our menu! In this example, my Assistant is telling me that the “Bird and the Bee” and “HoneyBree” are my Stars, driving high sales and strong margins, while “Coffee” and “Nutter Pumpkin Spice Waffle” are my Dogs, and I should probably re-evaluate these products on my menu. There are other recommendations for the Plow-horses and Puzzles as well that probably indicate I need to re-engineer my menu.
I was having too much fun to end there. I figured that since I have GPT-4 and Code Interpreter turned on, our Assistant is now a full-on data scientist who is an expert in Python, the most versatile programming language in the world.
So I decided to take a stab in the dark to see if my Assistant could also help me visualize my sales data: “Can you produce a chart showing the number of sales by each product by transaction date?”
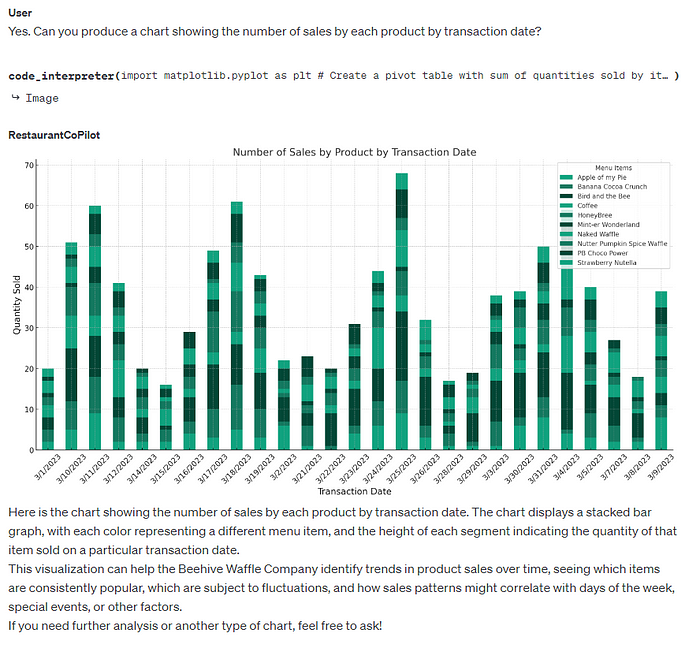
This is certainly not the prettiest chart. The color coding is difficult to read and the transaction dates are not even in chronological order. Let’s send the request back to the Assistant’s desk with this feedback: “Could you reproduce the chart with two changes: 1) use a different color palette to make the colors easier to discern, and 2) sort the transaction dates in chronological order”
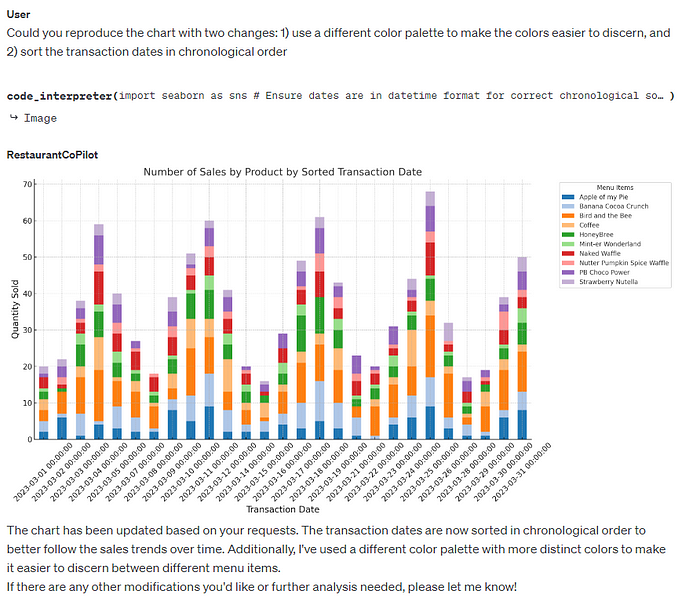
Would you look at that. It’s hard to be upset at a robot when they are so good at fixing their own mistakes. This chart looks great, and it got a lot easier to see why “Bird and the Bee” is my Star. Now when I ask it to create a different chart, it applies the same formatting I had previously requested. I guess this is what they mean when they say AI is continuously learning and self-tuning. Thanks Assistant!
And you can only imagine what else it can do. Give it a csv file containing responses from customer surveys and have it perform Natural Language Processing (NLP) on it to synthesize customer sentiment. Ask it to review a marketing copy or blog post advertising your business and provide suggestions to tailor it to your target market or suggest SEO terms to optimize search rankings. Ask it to review a csv of your businesses’ monthly expenses and search for cheaper alternatives to reduce your business expenses. Now you suddenly have a CFO, CMO and COO in your back pocket who are experts in your industry that you can simply pay as you go.
Before I ended, I wanted to follow up with the total cost I paid OpenAI for all the queries made in writing this article. As you saw at the top, I started with a balance of $7.33. As of this writing, my balance dropped $0.90 to $6.43.
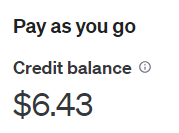
For the services rendered above, I’d like you to answer in the comments: Was this worth paying $0.90 for? Do you still need to hire a small business consultant or fractional CFO?
I wish I could suggest an off-the-shelf product you can use to accomplish what we just did above. While there are a few existing products that can serve as a virtual AI consultant, they are either lacking functionality or overpriced, or both. Built-in reporting features in your POS software, like Square reporting are pretty clunky and aren’t integrated with your accounting software to calculate net cashflows. Industry specific tools like Ekos are extremely expensive (try $500-$1,000/month) and still don’t have an AI consultant on board. And business owners I know who are using these products are still spending 10+ hours per week doing their own analysis by exporting their data into excel!
That’s insane.
I have made this problem a personal issue. I am throwing my hat in the ring to develop a better product at a better price for small business owners. Being a business owner, you need access to data and simple tools to make better informed business decisions and simultaneously free up your time so you can focus on your product. Who am I? My name is Nathan, and I am the author of this article. I am a data scientist and entrepreneur. I previously ran and operated the Beehive Waffle Company in Greenville, SC and have close friends running all sorts of businesses in the Upstate.
My vision for this product, Go Fig, is to provide businesses with all the support you’d expect from a fractional CFO for a fraction of the cost. My team is hard at work to launch an ultra fine-tuned AI chatbot with various time-saving and consulting features in January 2024, but you can already get a sneak peak of the demo, sign up for early access of the Beta, and even request features here.
If you want me to write even more content with tools and tips on how to integrate data analytics and AI technology to better manage your cashflows and unlock net new business growth for your small business, follow me on Medium or subscribe to the Go Fig newsletter.
I do want to caution anybody who wants to use ChatGPT in the way I demonstrated above. The information you share with ChatGPT using the Free account is not private or secure. Per its privacy policy, OpenAI can and will use this information in future training datasets.
That being said, OpenAI released ChatGPT Enterprise in August, which allows businesses to manage their end users’ data. The aforementioned All-in-One CFO product I am building, Go Fig, is built off of ChatGPT Enterprise and seeks to accomplish the same outcomes and more in a unified business interface while simultaneously keeping your business data private and secure.