Last Tuesday, I talked to a Finance Director at a fast-growing SaaS company who spent 45 minutes trying to get ChatGPT to write a simple revenue cohort analysis query. She described exactly what she needed in plain English: "Show me monthly recurring revenue by customer acquisition month for the last 12 months." The LLM confidently generated SQL that looked perfect at first glance—complete with proper joins and date functions—but failed spectacularly when she tried to run it against their Snowflake database.
The issue wasn't the complexity of her request. Any data analyst could have written that query in 5 minutes. The problem was that the LLM had no idea that their "revenue" lived in a table called billing_events, that "customer acquisition month" required joining to a user_signups table through a non-obvious external_user_id field, or that their date formats were stored as Unix timestamps, not standard datetime fields.
This scenario plays out thousands of times daily across organizations trying to democratize data access with AI, and AI projects like this one are notorious for not working out. But you try anyway because the idea of empowering decision makers with the ability to query databases using natural language and eliminating the IT bottleneck comes with a high ROI.
For a text-to-SQL data analyst implementation to be successful, you must build a Data Analyst agent that is properly trained on three kinds of context: your data schema, definitions of business metrics, and learnings from real-world examples.
At Go Fig, we work closely with data and Finance teams to tackle these challenges using proven metadata and governance strategies. This post sheds light on providing the right context to your agents via four different methods: direct prompting, fine-tuning, retrieval pipelines (RAG), and data catalogs like Select Star. This post will also offer guidance on when and how to use each approach, as well as the top data catalogs to consider.
The fundamental challenge with using LLMs for data analysis isn't that they can't write SQL. In fact, foundational models like GPT-5 and Gemini 2.5 Pro have become incredibly powerful, especially in writing SQL and other coding languages. The issue is that they're working blind when it comes to your specific data environment.
Think about how a human data analyst approaches a new project. They don't just start writing queries. They spend time understanding the schema, consulting subject matter experts across the organizations to solidify their understanding of business definitions, studying existing queries to understand patterns, and often making several iterations before getting accurate results. LLMs, on the other hand, are expected to produce perfect SQL on the first try with minimal context.
Here's what actually happens when you ask an LLM to generate SQL database queries without proper context:
Schema Hallucination: The model invents table and column names that sound reasonable but don't exist in your database. Ask for "customer revenue data" and it might confidently reference customers.total_revenue, when your actual table structure uses billing_summary.amount_usd with a complex join to user_accounts.
Business Logic Misinterpretation: The LLM applies generic business rules instead of your specific definitions. "Active users" might be defined as users who logged in within 30 days in the training data, but your company defines it as users with at least one transaction in 90 days.
Data Type Confusion: Without knowing your actual data types and formats, LLMs make assumptions that break queries. They might generate date comparisons using string formats when your timestamps are stored as integers, or apply text functions to numeric fields.
Relationship Misunderstanding: The model can't infer complex relationships between tables, especially when foreign keys don't follow standard naming conventions or when business logic requires specific join conditions.
The result? SQL that looks sophisticated but fails to execute, returns incorrect results, or worst of all, returns plausible but wrong answers that mislead business decisions.
For text-to-SQL agents to generate accurate, executable queries, they need three distinct types of context that work together to bridge the gap between natural language and your specific data environment.
Your data schema provides the structural foundation that LLMs need to understand your data architecture. This includes table and column names, data types, primary and foreign key relationships, and database-specific syntax requirements.
Without proper schema context, even simple requests become impossible. Consider asking for "total sales by region last quarter." The LLM needs to know:
transactions, orders, billing_events?)customer_region, shipping_address.state, sales_territory?)Effective schema context goes beyond basic DDL statements. It includes metadata about table relationships, column descriptions that explain business meaning, and information about data quality or completeness that affects query design.
Business context translates your organization's specific terminology and rules into data logic. This is where most text-to-SQL implementations fail—they assume business terms have universal definitions when they're actually highly specific to each organization.
Take "customer lifetime value" as an example. One company might calculate it as total revenue per customer since signup. Another might use a predictive model based on engagement metrics. A third might only count revenue from specific product lines. Without business context, an LLM will generate SQL based on generic assumptions that produce meaningless results.
Business context includes:
Usage context helps LLMs understand query patterns and conventions specific to your environment. This includes examples of successful queries, common SQL patterns, and user behavior that indicates what types of analysis are most valuable.
Usage context is particularly powerful because it provides the LLM with examples of how schema and business context work together in practice. Instead of trying to infer the correct join between customers and transactions, the model can reference similar queries that successfully performed customer-level analysis.
Effective usage context includes:
When all three types of context work together, LLMs can generate SQL that not only runs successfully but produces the specific insights your users are actually seeking.
There are four primary approaches to providing LLMs with the context they need for effective data analysis. Each has distinct trade-offs in terms of setup complexity, ongoing maintenance, and effectiveness at scale.
The most basic form of providing context is to include the context directly into prompts when making requests to the LLM. This involves manually including schema documentation, example queries, and business definitions in each prompt.
Prompting works well for prototyping or early-stage experiments. You can quickly test whether an LLM can handle your specific query types by including relevant table definitions and examples directly in the prompt. Many teams start here because it requires no additional infrastructure.
Example prompt:
Using BigQuery SQL, write a query that returns the top 3 customers based on revenue in the last 6 months. Schema: orders (order_id, customer_id, order_total, created_at), customers (customer_id, customer_name)Pros:
Cons:
Best for: Early validation, simple schemas with stable definitions, or one-off analysis requests where manual effort is acceptable.
Fine-tuning trains the LLM on your specific data patterns, schema, and query examples to embed domain knowledge directly into the model. This approach can significantly improve performance for stable, well-defined domains.
A fine-tuned model learns your specific table structures, common join patterns, business terminology, and query conventions. This can reduce the need for extensive context in each prompt and improve consistency across users.
Pros:
Cons:
Best for: Organizations with stable schemas, clear training data, and technical teams capable of managing model training pipelines.
RAG systems dynamically retrieve relevant context from a knowledge base at query time. Instead of embedding everything in prompts or training, the system searches for relevant metadata, examples, and documentation to include with each request.
A typical RAG implementation stores schema documentation, business definitions, and query examples in a vector database. When a user makes a request, the system uses semantic similarity to find relevant context and includes it in the LLM prompt.
Pros:
Cons:
Best for: Organizations with good documentation, evolving data environments, and teams comfortable with vector database implementation.
Modern data catalogs provide structured, API-accessible metadata that's specifically designed for programmatic access. Unlike RAG systems that search through documents, data catalogs offer standardized interfaces for retrieving schema information, lineage data, business definitions, and usage patterns.
Data catalogs solve the context problem by automatically maintaining comprehensive metadata about your data environment. They track schema changes, document business definitions, monitor query patterns, and provide APIs that LLMs can use to access current, accurate context.
Pros:
Cons:
Best for: Organizations with complex data environments, strong data governance practices, and teams that need reliable, scalable text-to-SQL capabilities.
Go Fig is an all-in-one solution to build AI data analyst agents by connecting with data sources and creating a data catalog tailored to organizations, allowing business users to self-serve data requests using natural language.
Data catalogs are becoming increasingly popular to solve the use case for creating a standardized, organization-wide AI data analyst due to their extensive features across data governance, business logic, and business rules. There are several options to choose from with their own unique strengths, including Google Dataplex, Select Star, Alation and Secoda.
Google Dataplex focuses on unified data fabric and governance across multi-cloud environments, with strong integration into the Google Cloud ecosystem. Go Fig integrates with Google Dataplex to build data catalogs for the organizations that we serve.
Pros:
Cons:
Best For: Large enterprises with significant Google Cloud investments needing comprehensive multi-cloud data governance, especially those prioritizing compliance and security over AI-first features.
Select Star is purpose-built for modern data teams with native support for AI workflows and LLM integration.
Pros:
Cons:
Best For: Organizations prioritizing AI-powered analytics with modern data stacks, especially teams wanting fast implementation of text-to-SQL capabilities with minimal technical overhead.
Alation offers enterprise-grade data governance with comprehensive compliance features and recent AI integration capabilities.
Pros:
Cons:
Best For: Large, regulated organizations needing comprehensive data governance and compliance capabilities, particularly in finance, healthcare, or government sectors where audit trails and data stewardship are critical.
Secoda provides fast, cloud-native data cataloging with built-in AI context capabilities designed for agile teams.
Pros:
Cons:
Best For: Small to medium-sized teams wanting fast AI implementation without enterprise complexity, particularly SaaS companies or startups prioritizing speed over comprehensive governance.
| Catalog | MCP/API Support | Main Strength | Main Drawback | Best For |
|---|---|---|---|---|
| Google Dataplex | Partial (API focused) | Multi-cloud governance | Limited LLM optimization | Enterprise multi-cloud environments |
| Select Star | Full MCP + APIs | AI-native workflows | Vendor lock-in potential | Modern teams prioritizing AI analytics |
| Alation | Recently added MCP | Enterprise governance | Complexity and cost | Regulated industries needing compliance |
| Secoda | Native AI integration | Fast deployment | Limited enterprise features | SMBs wanting quick AI implementation |
Even with perfect context, LLMs can still generate incorrect SQL due to their probabilistic nature and the complexity of translating natural language into precise database queries. Advanced text-to-SQL systems address this through sophisticated reasoning techniques that validate, refine, and improve generated queries.

Validation and rewriting techniques create feedback loops that allow the system to catch and correct errors before returning results to users. This approach treats SQL generation as an iterative process rather than a single prediction.
Query Parsing and Syntax Validation: Before executing any generated SQL, the system performs syntax checking specific to your database dialect. If the query contains syntax errors, the parser provides specific error messages that get fed back to the LLM for correction. This catches obvious mistakes like incorrect function names or malformed joins.
Dry Run Execution: The system performs a lightweight test execution of the query—typically using LIMIT 1 or EXPLAIN statements—to verify the query can run against your actual schema. If the dry run fails due to missing tables or columns, the error details help the LLM understand what went wrong and generate a corrected version.
Result Plausibility Checking: For queries that execute successfully, the system can perform sanity checks on results. If a revenue query returns negative values or a count query returns more records than exist in the source table, these signals indicate potential logic errors that trigger rewriting.
Multi-Pass Generation: Instead of accepting the first generated query, the system can generate multiple SQL variants and compare them. Queries that produce similar results across different approaches are more likely to be correct, while outliers may indicate errors in logic or interpretation.
This validation approach significantly improves accuracy because it gives the LLM concrete, specific feedback about what went wrong, rather than relying on generic error messages or user corrections.
In-context-learning leverages the LLM's ability to understand patterns from examples provided within the prompt context. For text-to-SQL applications, this means including relevant query examples that demonstrate your organization's specific patterns and business logic.
Pattern Recognition: When you provide examples of how your organization typically structures customer analysis queries, the LLM learns to apply similar patterns to new requests. If your examples show that customer metrics always exclude test accounts using WHERE customer_type != 'test', the model will apply this filter to new customer-related queries.
Business Logic Templates: Complex business calculations can be templated through examples. If "customer lifetime value" in your organization requires a specific formula involving multiple table joins and date calculations, showing the LLM 2-3 variations of this calculation helps it apply the same logic to new scenarios.
Query Complexity Scaling: Examples help the LLM understand how to build from simple to complex queries. Showing progression from basic table queries to multi-table joins to complex aggregations teaches the model your preferred approach to query construction.
Domain-Specific Conventions: Every organization has conventions around naming, grouping, and filtering that may not be obvious from schema alone. Examples make these implicit conventions explicit, improving consistency across generated queries.
The key to effective in-context-learning is curating examples that represent real business scenarios and successful query patterns, not just syntactically correct SQL.
Concrete examples make the difference between generic SQL that might work and SQL that actually serves your business needs. Here's how organizations implement business-specific examples effectively:
Customer Segmentation Example: Instead of generic customer queries, provide examples that show how your organization defines and analyzes customer segments:
-- Example: How we analyze enterprise customers
SELECT
    customer_id,
    customer_name,
    annual_contract_value,
    CASE
        WHEN annual_contract_value >= 100000 THEN 'Enterprise'
        WHEN annual_contract_value >= 25000 THEN 'Mid-Market'
        ELSE 'SMB'
    END as customer_segment
FROM customers c
JOIN subscription_summary s ON c.customer_id = s.customer_id
WHERE customer_status = 'active'
    AND signup_date >= '2023-01-01'
Revenue Recognition Example: Show how your organization handles complex business logic around revenue timing and recognition:
-- Example: How we calculate recognized revenue
SELECT
    DATE_TRUNC('month', billing_date) as month,
    SUM(CASE
        WHEN subscription_type = 'annual'
        THEN amount / 12
        ELSE amount
    END) as monthly_recognized_revenue
FROM billing_events
WHERE billing_status = 'collected'
    AND billing_date >= CURRENT_DATE - INTERVAL '12 months'
GROUP BY 1
ORDER BY 1
Cohort Analysis Example: Demonstrate your specific approach to tracking customer behavior over time:
-- Example: Monthly cohort retention analysis
WITH cohorts AS (
    SELECT
        customer_id,
        DATE_TRUNC('month', signup_date) as cohort_month
    FROM customers
    WHERE signup_date >= '2023-01-01'
),
activity AS (
    SELECT
        customer_id,
        DATE_TRUNC('month', login_date) as activity_month
    FROM user_activity
    WHERE login_date >= '2023-01-01'
)
SELECT
    c.cohort_month,
    a.activity_month,
    COUNT(DISTINCT c.customer_id) as cohort_size,
    COUNT(DISTINCT a.customer_id) as active_users,
    COUNT(DISTINCT a.customer_id) * 100.0 / COUNT(DISTINCT c.customer_id) as retention_rate
FROM cohorts c
LEFT JOIN activity a ON c.customer_id = a.customer_id
GROUP BY 1, 2
ORDER BY 1, 2
These examples teach the LLM not just SQL syntax, but your organization's specific approach to defining metrics, handling edge cases, and structuring analysis. When a user asks for "customer retention analysis," the LLM can apply the patterns from your cohort example rather than generating generic retention logic that may not match your business definitions.
Effective business-specific examples should cover your most common analysis patterns, include the edge cases and filters that matter in your environment, and demonstrate the level of complexity that your users typically need. This approach transforms LLMs from generic SQL generators into systems that understand and replicate your organization's analytical thinking.
We're at an inflection point in how organizations will perform data analytics. The technology exists today to democratize data access in ways that were impossible just two years ago. LLMs can understand natural language, translate business questions into SQL, and reason through complex analytical problems. Data catalogs provide rich, structured context about schemas and business definitions. Modern data warehouses can execute queries at scale with sub-second response times.
Yet most organizations are still stuck in the same cycle: business teams submit data requests, wait days for responses, and often receive results that don't quite answer their original questions or even in new custom logic that doesn't align with business standards. The problem is that the existing landscape of Business Intelligence tools require a high bar of data engineering expertise and a deep knowledge of the data architecture that effectively blocks out non-technical decision makers from accessing the core promise of self-serving data needs in a business-user-friendly UI.
The technology infrastructure exists today to make this vision real. What's been missing is a platform that combines these capabilities in a way that actually works for business teams. Go Fig represents that bridge—bringing the power of AI-driven data analysis to every problem solver in your organization, without requiring them to become data engineers.

The future of data analytics isn't about replacing analysts or forcing business users to learn SQL. It's about amplifying human intelligence with AI capabilities that understand business context and integrate seamlessly with existing workflows. Because the most sophisticated analytical insights should be accessible to anyone with the business knowledge to ask the right questions.
Ready to see how AI-powered data analysis can work for your team? Schedule a demo to experience how Go Fig turns natural language questions into accurate business insights, delivered directly into your existing workflows. Because in today's market, the speed of insight determines the speed of success.
Ever started working on a project with data in an Excel spreadsheet only to find the data is out of date? Spreadsheets are the go-to tool for Finance teams to perform analytics, financial modeling and forecasting. But data that is out of sync with the latest information is a major limitation on the value of those projects.
If you've ever worked with data in your organization, you have probably felt a similar pain. If not, it goes like this: It's Monday morning, you need updated revenue numbers for the board deck due Wednesday, but the CSV export IT sent you last week is already stale. You submit another ticket, mark it "urgent," and hope you'll get the data before your deadline.
This problem isn't just painful, its costly for both Finance and IT.
What if I told you that you could effortlessly keep the data in an Excel Live spreadsheet in sync with the latest data from your database? Yes, really. Keep reading.
In most organizations today, there is an ongoing tension that exists between the IT team and their business counterparts. And I'm not talking about the tension where finance tries to limit IT's budget (Go Fig can help alleviate this friction as well by relieving IT bandwidth, but more on this later).
The tension I'm talking about here is the need for data from finance, and the burden these requests create for the IT team:
Finance teams are completely dependent on IT to source data because they can't write SQL and don't even have database credentials. Even when business intelligence (BI) tools do allow for CSV exports, if the existing dashboard isn't exactly what is needed, they default to filing an IT ticket. BI is either too complex to use or the team simply refuses to learn it because spreadsheets are where the real value is. The result? Projects get delayed by days to weeks just waiting for turnaround on their data requests, and spreadsheets simply aren't updated nearly as often as they should be due to this friction.
IT teams are overly burdened in adhoc data requests. Every "quick" data request takes them away from focusing on strategic IT initiatives. A typical data engineer could spend up to 20 hours per week—literally half their time—responding to requests with varying degrees of urgency from finance, sales, and marketing. And the complex technical strategy they were hired to execute gets put on the backburner.
It's a lose-lose scenario that's costing both teams their sanity and the company's competitive edge.

I can already hear the battle cries from data folk that Finance teams should learn SQL or BI. As someone who started off in Finance and eventually did go on to learn SQL and Python in my transition to Data Science, I'm going to make this next prediction very confidently: finance professionals are not going to abandon Excel or Google Sheets anytime soon, and they shouldn't have to.
If I told you there was a data product that was fast, simple and easy to use, everybody on your team already knew how to use it, and as of last week integrates with AI, wouldn't that sound like a product you would buy for your team? Oh and btw, this product was basically free.
That's exactly what a spreadsheet is.
Spreadsheets are fast, powerful, versatile tools. To be honest, very few BI tools can compete with the spreadsheet in a footrace in the last mile of exploratory analytics.
However, the bigger problems with spreadsheets is when users do too much with them: heavy computational data retrieval, data cleaning, and pivoting across dozens of sheet tabs referencing more than 1,000,000 rows of data. Or saving multiple copies of the same spreadsheet to solve for the lack of inherent version control. These are the limitations that a data tool needs to solve for.
Introducing data workflows: no-code ETL that clean, process and aggregate data before shipping it off to a spreadsheet for slicing and dicing.
Imagine a scenario where business stakeholders in an organizations could completely self-serve their data requests:
This isn't a fantasy.
This capability already exists in the Power BI suite: UpSlide describes Power Query as the perfect solution for business users to interface with data in a low-code UI for organizations that don't have a data engineer. It does take some training, as the Power Query logic is noticeably different from standard spreadsheet logic.
Go Fig offers a simpler alternative solution to this problem with visual workflows that work with existing spreadsheet logic.
A Finance Director at a 200-person B2B SaaS company was working on a project to understand operating costs. Previously, they would wait multiple days for IT to pull data from their MS SQL Server into a Power BI dashboard. The Finance director would ask IT for updates on a regular basis, and access the data by downloading the Power BI tables as a CSV. This created a lot of friction in the initial model build, and very challenging to monitor costs to identify spikes in costs quickly.
With Go Fig, they've set up an automated workflow that:
Results:
Leadership at a real estate startup needed to predict cash flows 6 months out to manage their burn rate. They were manually downloading real estate market data from Redfin and combining it with internal sales data—a process that took 8 hours every month.
With Go Fig, their new workflow is completely automated and provides insights more frequently:
Results:
The CFO now has real-time visibility into cash position, and the analyst who used to spend a full day per month on this now focuses on strategic analysis instead of data wrangling.
The breakthrough comes from no-code workflow builders that speaks the language of the business, not IT's. Instead of writing SQL queries like:
SELECT customer_id, SUM(revenue) as total_revenue
FROM transactions
WHERE date >= '2024-01-01'
GROUP BY customer_id
Finance teams use familiar spreadsheet logic:
Even better, with AI assistants like Fig AI, you can simply describe what you need in natural language. For example: "Pull last month's revenue by customer and update my forecast model every Monday at 8am."
If you're still manually updating spreadsheets or waiting on IT for data refreshes, you're not alone. Most finance teams are stuck in this pattern because they don't have the right data tooling. But the technology exists today to connect your spreadsheets directly to your data stack—no SQL required, no IT bottleneck, no more stale data.
The companies that figure this out first will not only experience cost savings, but also increase the engagement of their teams by enabling them to make use of their data to add more value to the organization. And they'll be less likely to leave for a less tech-enabled organization.
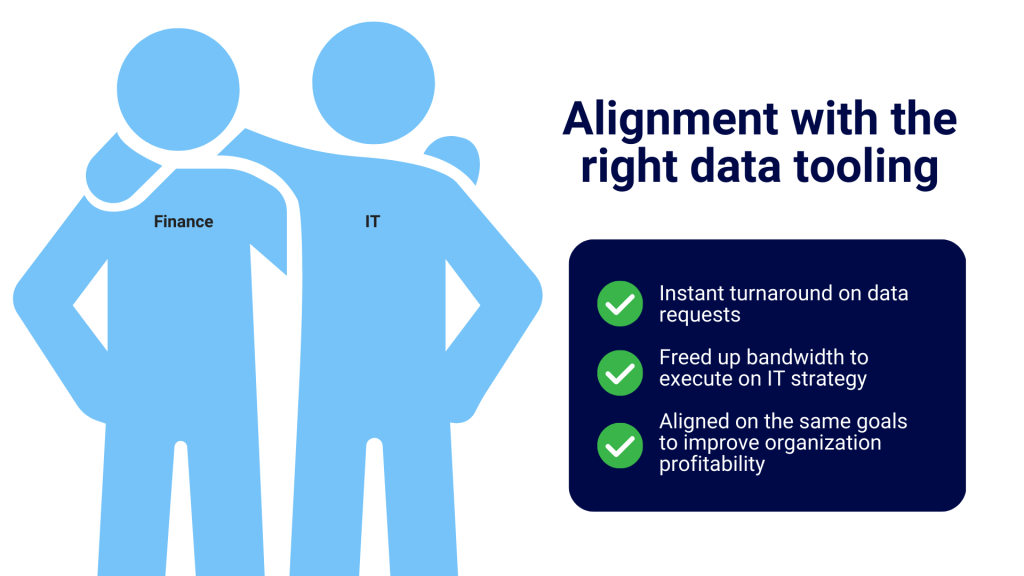
If you are an IT leader and you've read this far, you care deeply about enabling your partner teams with the right data tooling. Kudos to you. If you're still on the fence, here's a message I want to reinforce: enabling finance and business teams to self-serve their data needs isn't giving up control. It is strategic delegation. When you implement a no-code workflow solution, both you and your partner teams benefit:
The most forward-thinking IT teams are actively implementing data tooling that better supports business teams because they are starting to recognize that BI tools are failing to meet the business where they need support in regards to adhoc data requests. And freeing up these resources equally benefits IT with more time and focus to build robust, scalable infrastructure that further enables the entire organization. This is a true win-win outcome.
Last week, I talked with the CIO at a tech company in Columbia, South Carolina. They were lamenting about how their Finance manager spends hours updating the same report every month. Spreadsheets and data science are closely related, and he helped connect a spreadsheet to their database so that it had all their information, but it contained millions of rows of data. This has so much data, that simply updating one action in a pivot table takes an hour to update.
This was the same Finance manager who he described as a brilliant individual who could build a complex DCF model in her sleep, yet she was stuck doing digital grunt work.
The irony wasn't lost on me, or on the CIO I was talking to. We both knew that a few lines of SQL and Python can pivot and aggregate millions of rows of data in a fraction of a second.
How can that be? Spreadsheets are an incredibly powerful tool and has one of the most versatile interface that we have all come to know and love.
But the upside of the familiar user interface is also the downside of its speed and performance. Spreadsheets have limitations on the amount of data that it can work with, and will start to get buggy and crash if it exceeds these limits.
Coding with SQL and Python on cloud-based environments, on the other hand, is lightning fast. But it comes with the downside of not having any UI.
If you're reading this, you probably recognize yourself in that story. You've built financial models that would make McKinsey consultants weep with envy. You can manipulate data in ways that reveal insights others miss. You speak fluent VLOOKUP and think in terms of scenarios and sensitivities.
But you're dependent on your IT team to get you the data you need. You feel bad about bugging them, so you only ask them once a week for a refresh. You wish you were manifested the full capacity of a data scientist to work out of SQL and Python, so you try asking ChatGPT to write some code for you, but it doesn't seem to be working out the way you hoped it would
You're essentially doing data science—you just don't have the tools to match your ambition. What you need is a way to marry the computational power of code with the flexibility and familiarity of spreadsheets.
Here's what I've learned from talking to hundreds of finance professionals and business analysts: you don't actually want to learn Python or become a data engineer. You want the outcomes that data science delivers—automated insights, scalable analysis, real-time intelligence—without having to rebuild your entire skillset.
You're caught between two worlds. On one side, you see data scientists pulling insights from massive datasets, building predictive models, and automating complex analyses. On the other side, you're stuck manually refreshing data connections and praying your SUMIFS formula captured all the edge cases.
The problem isn't your skills—it's that the tools haven't evolved to meet you where you are. This challenge is increasingly common in modern data analytics, where business users need advanced capabilities without technical barriers.
Think about it this way: you wouldn't expect a surgeon to forge their own scalpels, yet we expect finance professionals to become software engineers just to automate their reporting. It's backwards.
Forget about dashboards and data lakes for a minute. When I talk to finance teams about what would genuinely transform their work, it always comes down to three core needs:
Remember the last time you presented budget variance analysis, only to have someone in the room question whether you were using the latest actuals? That sinking feeling when you realize your "current month" data is actually from two weeks ago because someone forgot to update the export from the ERP system?
The truth is, most financial analysis is built on a foundation of stale data held together by manual processes. You spend more time verifying data freshness than actually analyzing what the numbers mean.
What you really need is a direct line to your live business data—not another CSV download, not another "can you refresh this report," but actual real-time connection to the systems that matter. Your revenue recognition platform, your CRM, your operational databases.
Here's a scenario that probably sounds familiar: You're trying to analyze customer lifetime value across different acquisition channels, but Excel keeps crashing because you're dealing with three years of transaction data across 50,000 customers. So you break it into smaller chunks, run separate analyses, and manually piece together the insights.
Or maybe you want to build a cohort analysis to understand subscription churn patterns, but it requires complex SQL joins across multiple tables that would take your IT team weeks to set up (if they even have time to prioritize it).
The computational power exists to solve these problems instantly. Data scientists working with the same datasets would have answers in minutes, not days. The barrier isn't the complexity of your questions—it's that you need the processing capabilities of Python and SQL without having to master Python and SQL.
Let me be controversial for a moment: spreadsheets aren't the enemy. They're actually the perfect environment for the final mile of financial analysis. The problem is when they become the entire journey.
You need spreadsheets for that final layer of modeling speed and flexibility—the what-if scenarios, the presentation formatting, the collaborative review process with your team. The CFO who wants to adjust assumptions and see results instantly. The board member who wants to drill down into a specific metric during the presentation.
But you shouldn't need spreadsheets for data extraction, transformation, and basic aggregation. Those are computational problems that deserve computational solutions.
The ideal workflow? Automated data processing that feeds clean, validated, current results directly into a tab into your spreadsheet, where you can apply your analytical superpowers without getting bogged down in data plumbing.
This approach aligns with modern data democratization strategies that give business users self-service capabilities while maintaining data quality.
This is where most "solutions" fail you. They either dumb things down so much that you lose analytical power, or they expect you to become a part-time developer just to get your quarterly variance report.
I've watched finance teams try to adopt traditional BI tools, only to discover they can't modify the canned reports when business requirements change. I've seen analysts attempt to learn Python, then give up when they realize they need to understand data engineering concepts just to connect to their company's database.
The market keeps telling you to pick a side: either accept the limitations of spreadsheet-based analysis, or invest months learning technical skills that aren't really your core competency.
What if there was a third option?
Look, I'm obviously biased here—I built Go Fig specifically to solve this exact problem. But let me tell you why this matters to you.
Traditional data tools were built by engineers for engineers. They assume you want to learn their technical frameworks and adapt your thinking to their constraints. Go Fig flips that completely around.
We started with a simple premise: the most sophisticated business minds shouldn't be constrained by technical limitations. Your ability to model complex scenarios, identify meaningful patterns, and generate actionable insights shouldn't depend on whether you know how to write a SQL query or how to access data where it lives.
Instead of forcing you to learn data science, Go Fig brings data science capabilities into your existing workflow. You work with the same conceptual frameworks you already understand—tables, relationships, calculations—but with computational power that can handle enterprise-scale datasets.
And here's the key part: any Workflow built in Go Fig can export data to Google Sheets or a local CSV. Not because we couldn't build a fancier interface, but because we know that's where you do your best analytical work. Where you can tweak assumptions, collaborate with stakeholders, and present results in the format that actually drives decisions.
Learn more about how this integration works in our guide to automating reporting workflows.
I talk to CFOs every week who tell me their teams are still drowning in manual reporting despite significant investments in business intelligence platforms. The problem isn't the technology—it's that most data tools weren't designed for how finance professionals actually think and work.
You don't need another dashboard. You need computational automation that respects your analytical process.
You don't need to become a data scientist. You need data science capabilities that work within your existing expertise.
You don't need to abandon spreadsheets. You need spreadsheets fed by systems that are worthy of your analytical sophistication.
That's exactly what Go Fig delivers. And honestly? It's about time someone built a tool that meets you where you are instead of demanding you become someone else.
Ready to stop settling for manual data plumbing? Explore our step-by-step implementation guide for finance teams looking to modernize their analytics without losing spreadsheet flexibility.
Ctrl + C => Ctrl + V is a language that is deeply ingrained to my fingers. They allowed the elixir of life to take a dusty spreadsheet system and revive it, no automation necessary.
You likely know what I’m talking about– tabs and tabs of pivots, reports, forecasts and assumptions all laid out in a neat format. For the everyday spreadsheet poweruser, you would have likely performed these keystrokes hundreds or thousands of times over the course of a career. They allow an amazing, yet static system to stay up to date with the latest data so the output is relevant to the users and stakeholders of the organization.
The beautiful thing with spreadsheets is how it enables problem solvers of any technical ability to get the job done. This is also how I started my career in analytics at a major financial institution that was the first to apply “data-driven insights” into their core lending strategy.
I want to take you back to my early days at Capital One, where a typical project I worked on would last 2 to 3 months. The first 2-3 weeks was where the bulk of the spreadsheet system creation was performed. For a typical project in the world of credit risk, this analysis would consist of getting the latest loan chargeoff performance of past originations by risk tier to update valuation forecasts.
The remaining 6-9 weeks were spent creating a recommendation, collaborating with stakeholders and iterating. At the start of each week in this phase, I would pull down the latest risk data: delinquencies, charge-offs and recoveries, and perform the Copy & Paste maneuver to update the data in my project spreadsheet system.
I never thought too much about this. Mostly because the process worked. That is, until one day I made a huge mistake that almost cost me my job.
A day before a high-stakes meeting with a senior Credit Risk Manager, I had hastily repeated the Copy & Paste exercise yet again to update my presentation with up-to-date data.
But I made the mistake of not updating the bounds of my pivot table. The latest data was in the "data" tab, but the analyses tabs were missing the bottom 20% of records that were sorted by loan default risk.
In practical terms, that meant that my presentation was showing default rates being heavily skewed towards an artificially lower number.
As I proudly presented my findings, I could see the CRM's face quickly shift from a smile to a frown. He of course was a veteran Excel user himself and had a close hand on the pulse of default rates in Subprime lending.
He immediately questioned my numbers, told me to take another look, stood up and walked out of the room. Within minutes of scrambling through my spreadsheet, I found he was right.
A simple oversight like this if left unnoticed could have resulted in a business decision that would have had a dire consequence. Catching it this early was truly best-case scenario, but it still cost my credibility and my ego took a hit.
Fortunately, I did not lose my job. Capital One prioritized the development of human capital that I have always admired where mistakes were seen as a lesson and a stepping stone towards a deeper understanding of the business we were in. (There was a running joke that in order to become a Senior Vice President, you’d have to make a mistake that cost the company at least $1 million, because every leader had lived and learned through such a mistake).
But I did start to think— there’s got to be a better way to manage the lifeblood of how we propose changes to our credit risk policy.
When I shared this story to a peer in Tech, I got a chuckle paired with an eye roll, and was quickly introduced to the two key tenets of software engineering: version control and automation.
Have you ever seen a spreadsheet system that had a clever naming system to maintain versions?
I’ve seen a lot of different versions of these. The purpose of course is to create checkpoints in a spreadsheet system as users go through multiple iterations, especially when there is collaboration with other team members.
It’s a very intuitive system, and in fact, it's where Tech started as well. It wasn’t until 2005 that a system was invented to effectively manage versions of a codebase. This system of version control is called git. It was widely adopted over the following decade, and is the current defacto version control system today.
There are visual representations of git with tools like GitHub and GitLab that allow you to see which user made specific changes to specific files within a codebase, and allows users to merge two versions of the same file together, all while handling conflicts where the same part of code was changed in a file. There’s more protection around publishing changes to the main version, increased documentation into the changes that have been made, and best of all, it encourages more collaboration amongst developers.
Yet, git was never been extended to support changes within a spreadsheet, and thus wasn’t supported beyond programming. Cloud-based instances of spreadsheets (including Microsoft 365 and Google Sheets) have implemented a “Version History” feature, but they still don’t enable the full benefits of git: there’s zero documentation of what changes were made and users who duplicate a spreadsheet to test a separate version can’t easily incorporate changes back to the main spreadsheet system thus inhibiting collaboration.
The core benefit of programming is the ability to complete a repetitive task by producing a system and setting it on auto-pilot. Not AI or anything crazy, just a set of tasks that are triggered on a basic schedule: “at 6am every weekday: update the data in the spreadsheet system and ensure the pivot tables are referencing the new size of the data table”.
The benefits extend well beyond simply saving time. I’d argue it really is more about quality.
When you set up a repeatable system, you can define the actions that need to happen, test them, and iterate into perfection. The system will then run every time with consistency and complete flawlessness.
In practical terms, instead of data being refreshed in the spreadsheet system weekly, it can be updated daily or even hourly. Instead of rushing to update numbers right before a meeting, the user can calmly focus on the latest trends and insights shown in the report, and strengthen their presentation.
Of course, who wouldn’t want to perform at the technical level of a programmer. It would be a no-brainer to adopt version control and automation if it were available. The hurdle has always been that most people aren’t actually programmers.
Is that it though? Do we just settle with Copy & Pasting to manually provide life support to analytic projects?
No way.
In the world of AI, it is possible to “vibe code” a solution using Python and not actually know how the code works. Admittedly not my best proposal, but it is arguably a better “good enough” version than manual copy and pasting.
But I would push one step further.
Use Go Fig.
Okay, I know you know, when it comes to all the data tools out there, I’m going to be biased towards Go Fig.
But that’s because we built Go Fig specifically to offer business users the ability to have full control of code-powered analytics without requiring technical experience in a way that no other data tool has cared to. Despite all the fancy business intelligence software that has been developed over the years, business users are still defaulting to the spreadsheet because data tools come with a lot of technical barriers to modify and customize.
I can’t begin to tell you about how many calls we have with tech leaders every week who vent about how their business teams are still primarily reliant on the spreadsheet, despite all their effort on building dashboards, and continue to be burdened by the same issues I faced in my early career.
The special thing about Go Fig that no other data tool has been able to solve for, is that it combines the benefits of code with the familiarity of spreadsheet formulas, so that problem solvers who do not want to learn programming can still benefit from the power of SQL & Python.
All with a minimal technical barrier to entry.
Go Fig is also loved by heads of Engineering and IT– by offering a robust and intuitive tool that integrates with their data stack to business users who can self-serve, it reduces those users’ dependence on IT, thus freeing up bandwidth to work on more impactful technical strategy.
Try Go Fig risk-free now or request a demo to learn more details.
Go Fig was recognized by SC Biz News as one of the top 20 startups in South Carolina that are experiencing early success stories and strong growth potential. In addition to the recognition, they published highlights from multiple interviews with founder Nathan Freystaetter:
"With just three employees, the startup has positioned itself as a specialized resource for data and analytics in Greenville. The company advises other startups and businesses on data infrastructure, engineering best practices and effective data usage."
Click here to see the full list of the top 20 startups in South Carolina. Honorees featured run the gamut from tech to lifestyle to retail. All of them have one common trait: the drive to succeed.
SC Biz News is South Carolina’s leading business media organization, providing statewide news, analysis, and events through regional journals, magazines, and digital platforms for the business community.
Nathan Freystaetter founded Go Fig in 2023 to help finance and product teams use data better with the power of code alongside the familiarity of spreadsheet functions. With AI and a simple, intuitive UI, the users of the app can perform advanced analytics on large, connected datasets without needing to write a single line of code.
Nathan has a background in Finance and Data Science in Fortune 500 and has built this technology to "replicate himself" and build a tool for smaller enterprises to perform like a larger enterprise without the cost of hiring a full data team.
April is Innovation Awareness Month in South Carolina. Founder Nathan Freystaetter was interviewed by Fox News Carolina correspondent Myra Ruiz this morning in downtown Greenville South Carolina to share his experience building Go Fig in South Carolina:
"[To me, innovation means] being in that deep mental space where you're really trying to think through a problem and finding a better way to do things. It's about not being satisfied with the status quo. It's about constantly questioning what we're doing and why we're doing this so that you're really spending time on what's most important."
Let's have an honest conversation about SaaS in 2025. It's a highly saturated market with fierce competition, and everyone is yelling the same things about how their AI is the better than the competition. Many companies are seeing growth begin to stall while others seem to keep scaling sustainably.
This divide exists even in mature SaaS companies, as many are facing an enormous pressure to innovate to stay relevant in a rapidly evolving environment, grow users and revenue while also maintaining profitability to demonstrate the Rule of 40 for investors.
At one point or another, every SaaS company has experienced stalling growth and has felt its painful consequences:
In this world of hyper competition, stalling growth can be the nail in the coffin-- eventually stalling growth turns into steady and then a rapid decline in market share and revenue.
Keeping an eye on when your SaaS will plateau and avoiding stalling growth is always preferred. But what do you do if you've already found yourself in a plateau?
In this article, we’ll explain how to scale a SaaS company sustainably. We'll explore holistic growth and retention strategies via business development, customer success, team building, and then share how data can be leveraged to drive impact.
Read on for actionable tips tailored to the unique challenges and opportunities SaaS companies face in 2025 and beyond!
In physics we learn that without gravity, an object in motion will stay in motion into perpetuity. It is only because of friction between the object in motion and the surface it is traveling on that causes the object to come to a complete stop eventually. In order to continue traveling at the same speed, you need continued force: the combustion of gasoline in the engine of a car, for example.
Extending this metaphor to your SaaS: the friction that keeps your SaaS from continuing to grow at the same rate over time include 1) infrastructure, 2) churn, 3) market competition and 4) evolving customer needs.
Addressing these challenges early is vital to prevent growth stalling and scale successfully.
As more and more users adopt your product, your SaaS will require increased infrastructure and resources to support all your users without compromising performance.
This can be both expensive and complicated.
When building out your tech stack, it’s important to consider future growth—even if you’re still small today.
Some teams prioritize new features too quickly, which can lead to growing tech debt that may require more computational resources than necessary.
It’s essential to regularly take a pause to review your architecture and optimize computational resources.
One benefit of adopting cloud infrastructure is that you can implementing automation tools to scale your infrastructure when you need it in an instant.
Infrastructure is never sexy to talk about-- but it is key, which is why we put it first. By addressing these factors early, you can ensure your infrastructure grows seamlessly with your business.
Okay, now let's get on with the other friction points.
What makes a SaaS business special is the recurring nature of its revenue.
The best SaaS products solve a very painful aspect of their users' business or personal lives, and they're willing to continue to pay for your product to address that pain.
If 100% of your existing users continue to pay for your product, each new sale is incremental, and your growth begins to look like an exponential curve.
Churn suggests your solution isn't solving the user's pain in the way they expected it would.
If left unchecked, at some point the number of users that churn from your SaaS will become equal to the number of new users that adopt your product, and your growth will completely flatline.
Because of this, it is incredibly important to understand who your customers are and why they choose to leave, so that you can get in front of churn early.
Regularly talk to your customers, get feedback and offer personalized support in the early months of onboarding to ensure smooth adoption.
Another explanation for churn could be that your competitors are solving user's pain better than you. Let's talk about that next.
It is expected that by the end of 2025, there will be around 72,000 SaaS companies operating globally, more than 2x from 2024.
This level of increasing competition means that SaaS companies need to work extra hard to build an amazing product with strong product-market fit to be the reason for customers to choose your SaaS.
Finding product-market fit may mean niching down into a specific industry or market and delivering extremely well-tailored products and features that those specific customers love.
Having an amazing support experience is a great way to differentiate yourself from competitors as well.
And because your customer is at the center of it all, let's focus on their needs.
Nothing stays the same forever. Your customers are no different.
With changing expectations with AI and other new technologies, your customers will have new expectations from your SaaS over time.
If they are using AI copilots in all their other tools, but your tool doesn't offer a copilot, they may begin to see your product as insufficient, even if it continues to do what they expected from it the past 2 years.
This is another reason to have some line of communication with your customers. Allow your Customer Success team to collect feature requests, escalate complaints, and feel like they have a voice at the table in building your product.
And then actually prioritize your customer's evolving needs.
The foundation on which you grow your SaaS will be the engine that will allow you to travel the distance.
If you want a guarantee of getting from where you are today to point B in the future, you need to keep your engine well oiled.
Take each of these 4 elements into consideration as you maintain your engine as you grow.
As your SaaS grows, it becomes a challenge to stay on top of every aspect of your Go to Market strategy: marketing, sales, customer success.
This may sound surprising at first, since data infrastructure does not directly add value to the product or users, and can be an expensive investment to make early on.
But having access to the granular interactions your customers have across your GTM funnel is incredibly valuable to every layer of an organization.
Data are the dots, that when connected, tell you the whole story across everything you do:
Having access to this information allows you and your teams to fine-tune your GTM strategy, improve product-market fit, mitigate churn and ultimately grow faster.
Pricing is one of your biggest growth levers in SaaS.
And yet most SaaS products on the market are underpriced.
The cost of underpricing a SaaS is huge. Beyond generating less revenue, underpricing SaaS has two hidden consequences:
Pricing can also be ingeniously engineered to scale with the value your SaaS provides to your customers. Customers would be happy to pay you more for more value they receive over time, effectively offsetting revenue "lost" from other customers churning.
When such expansion revenue exceeds churn, you would have achieved net-negative churn. SaaS companies that grow with net-negative churn grow at truly exponential rates.
Did you know that 40% of marketing spend is wasted and a third of sales-people are not pulling their weight?
Examples of a low efficiency GTM:
GTM is one of the most essential areas to have a robust data infrastructure, especially for SaaS companies that have tens of thousands of customers and hundreds of thousands of web visitors.
Only by understanding your visitors and customers can you fine tune the engine and optimize for efficiency.
As Marshall Goldsmith said perfectly, “what got you here won’t get you there.”
As your SaaS grows, so does your processes need to evolve.
Having a regular pulse check on your teams and internal processes will go a long way to ensure enduring success, through both good times and rough patches.
Get the leadership team in a room every quarter to set goals that need to get done by quarter end.
Create a scorecard for every team in the organization, and keep teams accountable on those goals every week.
Be sure to incentivize the right behavior and celebrate wins to foster teamwork and positive morale.
Push your teams to continuously innovate on how processes can be optimized to save time and improve the customer experience.
The level of management experience is the major differentiator that separates the strong companies that get to $1B+ valuation from the rest.
Now that we’ve discussed the fundamentals of SaaS growth, let’s discuss actional steps you can take today to avoid the trap of stalling growth and fuel more exponential scalability.
Did you know 90% of data that exists today was created in the last 2 years?
Every piece of software you use to build and operate your SaaS captures a wealth of information from your customers, core business functions and internal teams.
Every piece of software also has its own reporting tool that is useful for answering simple questions.
But if you don’t have a robust data infrastructure that stores and manages this information, you don’t actually own your data, and you won’t have the ability to harness the true value from it.
When we say data infrastructure, we mean the following components:
This type of data infrastructure can be expensive to setup, but it doesn’t have to be.
The rest of this article will provide actionable tips to scale your SaaS sustainably. In each one of these tips, we’ll demonstrate how data and which of these tools proves useful in supporting these actions.
It’s crucial that SaaS companies truly understand who they are serving: who is the end user, their companies, and their pain points.
If you dig deep enough, you will likely find recurring themes in these best customer types.
The more you know about your customers, the more accurately you can label them:
To accomplish this, work with your data science team to perform an extensive clustering deep dive. In this process, this team can collect as much data as is available for all of your existing customers. (Note: the more information you can collect from your customers from the start, the more effective this will be.)
Once the clusters are created (usually 3-5 clusters), they can be analyzed and validated with the Customer Success and Product teams. They can also help put together the personas for each based on the labels that are most strongly represented in each cluster.
If done correctly, you will find a cluster that has the highest lifetime value—these are your best customers. They get the most value from your SaaS and are most likely to advocate and evangelize your product.
You will also find a cluster that will not value your product to pay for it (in case of freemium) or stick around (high churn rate). These customers will likely show up in higher numbers and are a distraction.
Having created these personas, you can now go back to your GTM and evaluate which marketing and sales campaigns are driving the best-fit customers, and which campaigns should be halted immediately.
It also becomes a lot more reliable to predict the next 12 months of cashflows based on new customers that sign up this month.
How data can help: A clustering exercise is intrinsically data heavy. Before building a model, data needs to be cleaned and pre-processed with ETL tools, then stored in a Data Warehouse, so that it can be used to build the model using a Machine Learning tool. Once it’s built, the model needs to be productionized so that it can score new customer signups into their appropriate cluster on a daily basis. The output of the scoring needs to be saved back to the Data Warehouse for the purposes of analytics and dashboarding in Business Intelligence tools.
See a previous post where covered customer segmentation with a more visual example.
Having a deeper understanding of who your best customer is, you now have a narrower lens to focus on.
What features do these customers use the most, and what are they asking for the most.
If you want even more information, we would strongly recommend reaching out to 20 of your best customers and collecting as much feedback as possible.
Is your current product roadmap aligned with the priorities of these customers? If not, make the changes to ensure these customers’ needs are met in the future.
For example, if these customers are all telling you they want to be able to automate a recurring task using an AI copilot in your app, you can build this directly in the product for them.
Simultaneously, make sure all messaging and positioning on your website and ads are aligned with the product and use cases that your best customer is using your product for.
In some cases, this could be a real pivot in another direction.
While it may seem drastic, this is simply the process of discovering product-market fit.
How data can help: We can first identify our best fit customer in our Data Warehouse from our productionized model. By capturing your customers feedback in a survey tool, it can then be classified either by using Natural Language Processing or setting a prompt in a Large Language Model. This type of classification will categorize and tag the customer’s feedback into similar themes, or groupings, that can then be easier for product teams to synthesize and consume.
You might come to realize that your best fit customer is getting a great deal for the value they are receiving.
If this is the case, you have just found an opportunity to update your pricing model in a way that will work with you and your growth potential.
Do realize that a change to your pricing model is going to upset some users, and some users will churn because of it.
However, if you can make a pricing change that delivers an immediate 20% increase in net revenue increased, then it is worth it.
Better yet, the customers who choose to stick around will disproportionately be your best customers, so while you will lose customers, you will also increase the focus on the customers that matter the most.
This makes it easier to continue to build features for your best customers.
Here are some popular value-based pricing models to choose from:
The model you choose depends on the nature of your product and how your best customers use your product, and how they would prefer to pay.
If you’re nervous about how a new pricing model will affect existing customers, you can simply roll it out to all new customers first. If the conversion performance and feedback from new customers is positive, then you can confidently roll it out to all existing customers as well. Just be sure to give them adequate heads up-–3-6 months—to avoid surprises.
How data can help: By joining data from CRM, billing and a backend database into the Data Warehouse, one can quickly identify what the best-fit customers are paying and how long they’ve been on the platform, as well as how often they are using specific features on the platform. This would allow an analyst to quickly create scenarios of different pricing models and what the net impact on revenue would be as a function of churn and increased revenue in each model.
In a world where technology is constantly evolving, it is important to be sure you are staying ahead of the curve.
Incentivize your product teams to perform market research consistently to identify growth opportunities and potential threats in your space.
Market research may not only tell you where the competition is moving, but it could also reveal where there are emerging gaps in the market that you can fill!
This should be paired with regular customer interviews with your best fit customers.
Remember, they are also doing their own version of competition analysis for you. If they’re loyal to you, they will likely not jump ship to another product that has a feature they want. Instead, they will make this request from you.
Requests from your best customers are one of the best ways to learn what’s new and what would be valuable to add in your product offering.
Other potential sources of valuable research on your competitors:
How data can help: Competitive analysis and customer research provides some of the messiest data there is. Typically, a product team would have to read through pages and surveys line by line. This is incredibly time consuming and difficult to synthesize. Thanks to Large Language Models, this process can be mostly automated. Competitive data can be captured with web scraping and joined with survey responses. A Machine Learning or Analytical platform can run a LLM prompt to classify this data into categories to help reveal recurring themes.
SaaS that relies too heavily on “Fast” Marketing, marketing channels that have a quick turnaround to results, like paid ads or manual outreach are stuck in a tricky position.
Scaling with “Fast” Marketing usually means spending a lot more money and resources.
The alternative would be to invest in “Slow” Marketing—marketing channels that are much slower to turnaround value but are significantly more scalable.
These include Content Marketing, SEO and Email Marketing.
Content Marketing, combined with search engine optimization (SEO), drives organic traffic to your website.
SEO is the process of optimizing your content for search such that it lands high up on results pages to generate high traffic from search engines like Google and Bing.
This means that users who search for keywords that are relevant to your SaaS product will more likely be able to find your SaaS organically.
Content Marketing allows you to generate valuable content that educates your potential customers. It helps build brand equity and credibility, and these visitors may even choose to sign up for your email list, schedule a demo, or sign up directly.
You can then continue to nurture these prospects via valuable content and nurture campaigns via email. For those who don’t sign up, you can set up tracking and run retargeting campaigns to bring them back to your website.
Here are some best practices to create SEO content that resonates with the best prospects:
How data can help: After content is created, data engineering teams can leverage ETL and Business Intelligence to create automated dashboards to track key metrics for all content created, so that they can be evaluated on performance, and provide the feedback loop of what type of content works well for a company’s ideal customer profile. Anamoly detection can be set up to alert the team when a particular piece of content performs unexpectedly well or poorly, in order to prompt the content team to immediately dig further to understand and respond to the trend.
It is tempting to want to hire more salespeople to get more sales.
Sounds intuitive, right?
Don’t do it yet.
Start by evaluating the performance of your existing sales team. Look at performance metrics like number of leads, number of sales qualified leads (SQL), Lead-to-SQL conversion rate, number of sales closed and won, Lead-to-Won conversion rate, total dollar value of sales won.
Then evaluate the total occupancy and performance of each salesperson. It’s possible that your sales team is not yet at full capacity. If this is the case, work with Marketing to ramp up resources to send more Leads to the pipeline.
Simultaneously, work with Sales leadership to find opportunities to streamline processes to save time, and open up more bandwidth for each Salesperson to take on more Leads per month.
Continue to push the Sales team on higher efficiency and higher sales closings—Sales people are inherently very competitive and can handle it!
Once it becomes clear that there are more Leads than the existing Sales team can handle, then (and only then!) should you consider hiring your next Salesperson.
Hire slowly and ensure new hires are onboarded fully and ramp up to the same performance level as the rest of the team. Then continue to iterate over time.
This keeps the energy and morale in the Sales team high. The worst thing you can do is hire too many Salespeople at once and suddenly your top performers don’t have enough pipeline to continue meeting goals.
As unintuitive as it sounds, hire your sales team slowly!
How data can help: With the help of ETL and Business Intelligence, the data engineering team can create automated dashboards to monitor key metrics for the entire Sales team. Anomaly detection can also be set up to alert leadership when Sales performance drops unexpectedly, which may require a deeper dive to understand the story behind the trend and respond appropriately.
It is a lot easier (and cheaper) to upsell an existing customer than it is to acquire a new customer.
This cuts both ways.
Losing a customer is more costly than the cost to acquire a new customer.
So be sure to allocate sufficient resources to your Customer Success team to be there for your customers when they need help! This is especially true for onboarding and early adoption, where your engagement with customers as they start using your product is essential to complete adoption and support retention.
Your Customer Success team should be well staffed and fully cover the hours that your customers most often contact you for support. It is also important for this team to be sufficiently staffed so they can proactively reach out to customers, foster a community of collaborative support, and update the knowledge base according to product release timelines.
Once the Customer Success team can fully support the above tasks such that your SaaS has strong retention, you can expand their efforts to capture expansion revenue.
Here are some strategies to capture expansion revenue:
How data can help: A Data Scientist can build a Machine Learning model based on data on product usage trends, customer support contacts, and sentiment of those contacts to estimate the probability of that customer churning in the next 90 days. This model could run on a daily basis and feed a dashboard highlighting the highest value customers that are at highest risk of churn. The Customer Success team could use this dashboard to proactively reach out to these customers to understand their challenges and find opportunities to uniquely support them.
Sometimes it makes more sense to partner with another SaaS than to try to build out a new feature yourself. This all depends on the complexity of the feature requests you get, how many of your customers are requesting these features, and how much of an impact this feature would have on retention and acquisition.
Solving gaps with partnerships can often be the perfect solution to give you back the focus you need and simultaneously be mutually beneficial.
With the right partner, this can be a strategic alliance that allows you to tap into each other’s customer networks and open new channels for growth.
It can also build your credibility, improve your SEO search rankings, and lead to additional strategic partnerships that can further expand the growth flywheel.
If you are a leader in a SaaS company, you are probably also a tech power user.
Think about ways in which you can use workflows and automation to save time in your day-to-day and in the operations of the broader organization.
LLMs and AI play a key role in further bolstering automations. For example, instead of your sales team manually recording call notes and updating records in Salesforce or HubSpot, build an automated system where an AI voice recorder transcribes the notes, sends them to a custom AI agent in a N8N workflow that updates the corresponding records in your CRM.
This is useful for smaller teams with limited bandwidth to stay afloat, and even more so for larger companies that can scale without needing to hire as many people.
How data can help: A measurement of efficiency can be created for each employee in their function. A transparent dashboard can create a sense of competition amongst employees to perform at a higher level and further adopt automation tools to drive more value to the organization.
With all the advancements in technology, 2025 will prove to be an exciting year to scale a SaaS business.
While the market is saturated and highly competitive, there is also a huge opportunity to use new technologies to operate more efficiently and offer a uniquely valuable experience to your best-fit customers, moreso than your competitors can achieve.
To recap, here are the 10 actionable strategies to scale your SaaS:
Ready to scale your SaaS better than the competition?
Partner with Go Fig to set up your data infrastructure in 48 hours so you can start solving these problems later this week.
Traditional data infrastructure can take up to 12 months and cost over $1 million to set up. Go Fig leverages technical industry insight, automated tools and a highly specialized team of Data Engineers and Data Scientists to complete build out of your Google BigQuery warehouse so your organization can get the information it needs to tackle the most pressing challenges affecting profitability and growth later this week.
Contact Go Fig today to learn how we can help transform your vision into a reality.
How Do I Scale My SaaS Business in a Profitable Way?
Here’s how to scale a SaaS business in a profitable way. To scale your SaaS business profitably, focus on automating key processes, optimizing your sales funnel, and increasing prices as an immediate opportunity. Invest in a robust data infrastructure that gives proactive alerts on KPIs, slow marketing tactics that scale more cheaply, and explore synergistic partnerships with other complementary SaaS brands. Prioritize an amazing customer support experience to minimize churn, capture expansion revenue via upselling and cross-selling, and tailor your product roadmap to your best-fit customer.
What is the 3-3-2-2-2 Rule of SaaS?
The 3-3-2-2-2 Rule of SaaS is a growth framework that suggests your business should triple in revenue for the first two years and then double each year for the next three years. Specifically, grow 3x in years 1 and 2, then 2x in years 3, 4, and 5. This trajectory indicates a SaaS company has achieved product-market fit and is growing rapidly and in a sustainably way.
What is the Rule of 40 for SaaS Companies?
The Rule of 40 is a primary performance metric to measure the health of technology companies that balances growth and profitability. The Rule of 40 states that the sum of a company’s revenue annual growth rate and profit margin should equal or exceed 40%. For example, a company that grew 40% in the last year with a profit margin of 25% would be considered a healthy business with a cumulative sum of 65%.
What is the 20-20 Rule for SaaS?
The 20-20 Rule is a benchmark for how a SaaS should prioritize growth and profitability. The 20-20 Rule suggests that a company should aim for at least 20% revenue growth and a 20% profit margin. This balance indicates strong, sustainable performance, ensuring the company grows while maintaining healthy profitability.
How To Scale SaaS Sales Teams?
Before scaling your sales team, thoroughly analyze your existing team's performance metrics (including lead conversion rates and total sales value) and maximize their efficiency through process improvements and increased marketing support. Only consider hiring new salespeople when your current team is operating at full capacity and there are consistently more leads than they can handle. Use data engineering and BI tools to create automated dashboards and anomaly detection systems that help monitor sales performance and identify potential issues early.
What is the Growth Pattern of SaaS?
The growth pattern of SaaS typically follows an initial slow phase during product development and market fit, followed by rapid scaling as the business gains traction. Growth accelerates through customer acquisition, upselling, and market expansion. Eventually, growth stabilizes as the company matures, focusing on retention and sustainable profitability growth.
How Do SaaS Companies Get Leads?
SaaS companies generate leads through a combination of “fast” and “slow” marketing. It is best practice to implement a system of both fast and slow marketing solutions. While “fast” marketing solutions generate value more quickly, scaling them is incredibly expensive. “Slow” marketing solutions on the other hand take more time to return value, but scale more efficiently.
“Slow” Marketing Solutions:
“Fast” Marketing Solutions
The yield curve inversion continuing to re-invert and the threat of broad tariffs are mounting an increasing amount of uncertainty for companies across virtually every industry.
During a similarly uncertain time at Capital One in 2015, we were so prepared for a potential recession that we had a strong confidence a recession would make us better off in the long run, by capturing a larger market share from competitors that were clearly over-leveraged.
Here are three essential goals that leaders of growing companies should focus on to turn this uncertainty into an opportunity:
⚖️ Optimize operations to bolster up margins
💲 Prioritize the P&L for financial health
📈 Define a strategic growth plan
Lets break this down--
⚖️
"𝐸𝑓𝑓𝑖𝑐𝑖𝑒𝑛𝑐𝑦 𝑖𝑠 𝑑𝑜𝑖𝑛𝑔 𝑡ℎ𝑖𝑛𝑔𝑠 𝑟𝑖𝑔ℎ𝑡; 𝑒𝑓𝑓𝑒𝑐𝑡𝑖𝑣𝑒𝑛𝑒𝑠𝑠 𝑖𝑠 𝑑𝑜𝑖𝑛𝑔 𝑡ℎ𝑒 𝑟𝑖𝑔ℎ𝑡 𝑡ℎ𝑖𝑛𝑔𝑠"
This should always be a top priority for any organization. With smooth operations that produce strong margins, a company gets traction fast, and stands out as a winner when the money stops flowing in the economy.
𝗦𝗠𝗔𝗥𝗧 𝗴𝗼𝗮𝗹𝘀:
1️⃣ Read Traction by Gino Wickman
2️⃣ Build a scorecard and select KPIs that are strongly tied to the P&L
3️⃣ Set goals for each KPI and keep responsible teams accountable for them
4️⃣ Each week, dig into the root cause of key performance and take away one action item for the following week to slowly iterate towards operational excellence
💲
"𝐶𝑎𝑠ℎ 𝑖𝑠 𝑘𝑖𝑛𝑔"
This is especially true when there's less cash flowing through local economies. Also, a recession tends to be followed with lower interest rates and stricter lending policies, so now would be a good time to pay down debt and improve credit worthiness.
𝗦𝗠𝗔𝗥𝗧 𝗴𝗼𝗮𝗹𝘀:
1️⃣ Optimize operations as a pre-requisite
2️⃣ Build a cash reserve of 6-12 months of operating expenses
3️⃣ Identify loans with the highest interest rates and increase payments
4️⃣ Create a cashflow plan and stress test it against best case and worst case scenarios
3. "Adversity is the chisel that carves out excellence".
With the first two goals in place, growth companies would be in a good position to expand. In a best case scenario, there is a strong financial position to invest in new product lines or double down on marketing. In a worst case scenario, there is a strong financial position to acquire struggling competitors or capture their market.
𝗦𝗠𝗔𝗥𝗧 𝗴𝗼𝗮𝗹𝘀:
1️⃣ Have the leadership team formulate a strategic growth plan under best and worst case scenarios
2️⃣ Identify a few leading indicators of how a slow down affects your industry. Automate measurement of these indicators with proactive alerts so you can respond quickly.
You may have noticed these goals weren't just about survival. They are about taking advantage of an opportunity.
Whether a business leader or employee, which of these three goals would you want your company to tackle first?
In November, Go Fig received a $25,000 Project Development Fund Grant from the South Carolina Research Authority. The Greenville-based information technology startup’s software enables finance and product teams to perform advanced analytics on large datasets with the familiarity of spreadsheet functions.
Go Fig became a member of the SCRA earlier this summer and has shown strong early indicators of growth and traction. The promising early stage startup will be using the funds to support ongoing product development, develop a Go-to-Marketing strategy and expand marketing efforts.
The South Carolina Research Authority, or SCRA for short, is a nonprofit organization that fuels the state’s innovation economy by accelerating technology-driven growth in AI, technology, research, academia and industry through funding, expertise, and network.
Have you ever wondered how big companies keep track of all their data and then actually use it to make decisions? Imagine owning thousands of books in a library without any shelves or labels, and you needed to know how many stories had a protagonist named "Matthew"—that would be very time consuming to answer, right? Large companies face a similar challenge with their data. That's where a data warehouse and analytical software come in! You can read more about how data improves outcomes for growing businesses here. But before you get started, you need to know: What is the true cost of building a modern data infrastructure in-house?
A complete data infrastructure will detail the complete journey of data from its raw state to the procured insight that is used to eventually drive business impact. This includes the transformation pipeline that moves data from its source to the target data warehouse, the actual data warehouse that houses all the data and enables users to query data to perform analyses and finally the visualization software that automates recurring reports via dashboards.
Each of four components outlined above usually live in different software. Additionally, they require a team of data architects and engineers to tie in all the pieces together and provide ongoing maintenance and support. The cost for each will depend significantly on which software you choose and how much data is involved. A typical all-in-cost for a mid-market company ranges from $25k-$500k per year for the software plus resources and an additional $400k-$800k for salary and benefits of a professional data team to support and maintain the solution.
That cost may seem high at first, and it is. Let's break it down to get a more true cost for a company like yours.
Transforming raw data from its original source (i.e. accounting software) to cleaned data in the target data warehouse happens through a transformation pipeline, often referred to as ETL, or Extract, Transform, Load.
Data sources can include business software (i.e. Quickbooks or other specialized accounting software), databases (i.e. PostgreSQL, MySQL or other database), Google Sheets, CSV uploads and even unstructured text data (PDFs, word documents, Notion, etc). See here for an ever growing list of data sources that Go Fig supports.
Go Fig offers a No-Code Workflow builder with plug-n-play functions to clean and transform data into a format that is useful and suitable for analysis and reporting. Datasets that are not clean can potentially be dangerous, resulting in errors that can lead to misguided decision-making that creates risk for the business. According to Gartner, such bad data cost companies an average of $15 million in lost revenue in 2017-- significantly more than costs of building a robust data infrastructure.
All-in Cost: between $5k to over $50k per year depending on the plan you choose and the volume of jobs. Many ETL solutions offer a variable pricing model that starts off with a free or low introductory rate, but scales up rapidly as you begin to use it more. This keeps you locked in on elevated prices that can jump unpredictably on any given month with particularly heavy usage.
To keep costs lower and predictable month to month, you may want to consider an ETL solution with a fixed pricing model that keeps rates consistent, and only increases when you choose a higher tiered plan.
Go Fig, for example, charges a fixed monthly or annual rate for unlimited workload for any of the tiered plans offered and only increases if you exceed the storage limit for each plan. This allows you to know exactly how much the plan will cost and you will have months to plan for a price hike, if at all.
A data warehouse is like a giant, super-organized library for a company's information. It stores post-transformed data from lots of places, like websites, sales records, and customer lists, and stores it all in one location. This is also the place where people in the company go to access their data for creating reports and doing analysis on company performance.
Companies can store data on their own servers (called on-premises) or using an external cloud-based solution. Deciding between on-premise vs cloud solution is wholly dependent on the company. On-premise requires physical storage space, upfront investment in time and resources, and ongoing maintenance, but they also give the company full control of their data.
All-in Cost:
Starting out, a company will likely find it more cost efficient with a cloud-based data warehouse. Once a company's data infrastructure reaches a peak stage of maturity, it could migrate its infrastructure to its own servers to obtain more cost savings.
All data warehousing solutions offer a platform for analysts to write SQL queries to pull the data they need to perform specific analyses, such as explaining the main drivers of recent sales trends or investigating an opportunity to improve marketing outcomes. This operation has typically been reserved for professional data analysts with a strong understanding of relational databases and technical experience writing code to get accurate data. With the advent of LLMs and AI, it has become possible for others to also query accurate data to answer such questions.
Go Fig is an example of a company that is leveraging LLMs like ChatGPT to equip C-Suite leaders and frontline employees alike with this analytics capability. Our proprietary Harvest-1 foundational model is built to understand the intent of each individual user and translates requests into a simple and understandable No-Code Workflow and Fig that can be validated or modified further.
Completing the chain of the data lifecycle are dashboards, which are elegant visual representations of the data prepared in a consumable format for humans to understand and digest insights from data so they can make informed decisions that drive the business forward. Data visualization software that prepare these dashboards are often referred to as Business Intelligence, or BI tools.
Without a dashboarding software, data that lives in a data warehouse can be pretty meaningless, so this software is a critical piece to the puzzle in order to get value from your investment in data. Analysis that depends on a human to manually query data and update a static excel spreadsheet, as valuable as that may be, is slow and time-consuming. With dashboards, any type of report or data manipulation you would perform in Excel could be available in a dashboard, updated every time the underlying data warehouse is updated. Imagine saving 2 hours every Monday from your intern who manually updates your weekly sales report, and having that same report updated every day of the week.
Extending beyond visualization, more advanced BI tools offer features to proactively monitor data and send alerts proactively. For example, Go Fig can send an alert when sales by 12pm on a particular day are below the acceptable threshold, signaling that there could be a severe issue with the sales team that requires your attention immediately. Creating an alert is simple, simply determine thresholds for a pre-defined metric, and we'll check it every time new data is pulled in!
All-in Cost: the average business intelligence solution costs $3k per year, but can cost upwards of $10k per year for more advanced solutions
As highlighted above, the cost of bad data is higher than the cost to build a robust data infrastructure. Building a team of qualified and experienced data and software professionals is critical to accomplish this goal. There are four main roles that are typically required to set up and maintain such a data infrastructure:
All-in Cost: the average salary for each of these roles exceeds $100k per year. Midmarket companies will require at least 1 of each role, for a minimum $400k per year but can likely reach up to $800k.
That being said, some of the more advanced software solutions can simplify the setup and maintenance of data infrastructure. Go Fig, for example, manages data storage for you, offers a simple, drag-and-drop ETL solution with a user-friendly visual interface, AI-powered analytics and dashboarding, as well as managed service add-ons. Choosing Go Fig as your all-in-one solution could potentially save you a lot on both software and staffing.
Let's look at some pretend companies to see how much a data warehouse might cost them.
Costs:
Software Cost: $9k (ETL) + $1k (data warehouse) + $3k (Visualization) = $13k per year
Total Cost: $13k per year
Estimated cost using Go Fig's Self-Service Premium plan: $4,500 per year (savings of $8,500!)
Costs:
Software Cost: $25k (ETL) + $20k (data warehouse) + $15k (Visualization) = $60k per year
Staffing Cost: four full-time data professional at $500k per year
Total Cost: $560k per year
Estimated cost using Go Fig's Enterprise plan with fractional data services: $285k per year (savings of $275k!)
As we can see above, the all-in cost of building a robust data solution can be steep, starting with $10k per year for just storage and software and easily exceeding $500k for larger companies who need to hire out a professional data team for more complex solutions. Companies choose to invest in data solutions, however, because the return is significantly higher than the cost:
Data infrastructure does not need to be as complex as it once was. Go Fig allows companies to bring their data warehouse, ETL and visualization solutions all in one place. Go Fig is a powerful platform that is simple to use, yet offers customizations you cannot find in other platforms. It is specific to your company and you, so you don't need to be overwhelmed by all the clutter.
It turns out that making it extremely simple for C-Suite leaders to centralize and access their own data, you can significantly reduce the cost of building and maintaining your own data infrastructure. Go figure! Schedule a demo today to see how Go Fig can work for your unique business needs and objectives.
With just 1:30 left on the clock in the 2002 Super Bowl, the New England Patriots were locked in a 17-17 tie against the powerhouse St. Louis Rams. The pressure was immense as Tom Brady, a relatively unknown quarterback at the time, took the field on his own 17-yard line with no timeouts remaining. Displaying immense resilience, Brady navigated the offense efficiently down the field while simultaneously managing the clock carefully, culminating in an opportunity for kicker Adam Vinatieri to kick a 48-yard field goal through the uprights to seal the W in a thrilling ending as time expired.
Tom Brady's brilliance isn't that he suddenly received inspiration to know how to lead an offense in those final 90 seconds on the biggest stage in sports. His brilliance instead is on how much work and focus he put into designing and practicing their 2 minute playbook before the season started and again before each and every game.
You might be wondering how does football tie back to business.
In some ways, the 60 minutes of a football game resembles the various stages of the economy. There are ups and downs, and external pressures that might put your company in a situation that you'd rather it not be in. Nevertheless you might find your company in that position, and so the next best thing is to prepare your team to win by creating and practicing a playbook that outlines the strategy and specific calls you will make, and lead your team to victory just like one of the most decorated team captains in sports.
As a business leader, you probably plan to run your business for a long time, in which it is likely to experience the full lifecycle of an economic cycle, which includes periods of good times (expansions) and periods of bad times (contractions or recessions).
Your curiosity may naturally try to figure out what part of the economic cycle we're in right now. After all, the Fed just decreased rates by 0.50% in response to unemployment increasing to 4.2% in August 2024, up from a healthy 3.4% we experienced in 2022. Jamie Dimon at JP Morgan recently made a prediction that we'll begin to see more economic deceleration in 2025 and on top of it all, economists agree that the global economy has been in the late-stage of the business cycle for the better of the last two years. Lower interest rates could take some of the pressure off, but the Fed may just be trying to play catch up after leaving rates high for too long, and it may already be too late.
We don't know for sure where we are and when the next recession might be, and trying to make any accurate predictions is a fool's errand.
What is important is that you do have a plan for when it does happen, so your company can thrive through it all. While less intuitive, the same is true for why you would want a playbook to build the strategy to thrive through a period of rapid expansion.
While it may seem intimidating at first, creating a cycle playbook is as simple as following 3 steps, outlined in the TAP framework below:
We'll follow these steps to create a sample playbook using an example with a fictitious company, LaunchMinds, a marketing agency that helps clients with running their digital marketing strategies.

Businesses exist to create a profit, and you'll want to have a good sense of what your key performance metrics look like that drive that profit. These key performance metrics will look differently in each industry, but what they all have in common is the following components:
Do you need help with identifying and measuring the right key performance metrics for your company? Before you hire a consultant, we recommend setting up your own data infrastructure. Read our full guide for a breakdown on the costs to implement data infrastructure for companies of various sizes.
For LaunchMinds, their key performance metrics might include the following:
Cost per Acquisition (CAC): $15,000
The total cost, including marketing and sales costs, to acquire a single customer. Since professional services companies are consultants who take fewer and higher value clients, it is not too surprising for a company like LaunchMinds to spend as much as $15,000 to acquire a customer.
Acquisition Cost Payback: 3 months
The duration it takes for a new client acquisition to pay back the total costs of acquiring that customer. If LaunchMinds spent $15,000 to acquire a customer that adds $10,000 revenue per month with a 50% margin, then it would take 3 months for that customer to payoff the total costs of acquiring that customer.
Annual Profit per Employee: $300,000
Total annual profit divided by the number of employees working at the firm. This represents the value that each employee adds to the business.
Now lets stress test the company. The exercise of "stress testing" is to stress components of the aforementioned key metrics to see at what point company profit falls to its breakeven point. We'll start with two immediate observations of how LaunchMinds could go from a profitable to unprofitable business in a short period of time:
First, their acquisition costs are very high, such that they do not breakeven until 3 months after acquiring a new customer. If the customer stays with the firm for 12 months, then 9 months are adding value. If the average duration of a client gets cut in half to just 6 months, then the profit added from that client would decrease by 67%! If the average duration of a client falls to 3 months, then LaunchMinds would not make a profit at all. In other words, LaunchMinds is resilient to a decrease in duration of a customer up to 75%.
Secondly, the annual profit per employee is quite strong at $300,000. If the company experiences customers churning and a tougher time acquiring newer customers, this number could gets dangerously close to the breakeven point as well. If we plotted LaunchMinds profit per employee by decreases in client acquisition, we would see that Launchminds would become unprofitable if the total number of clients drop by 60%.
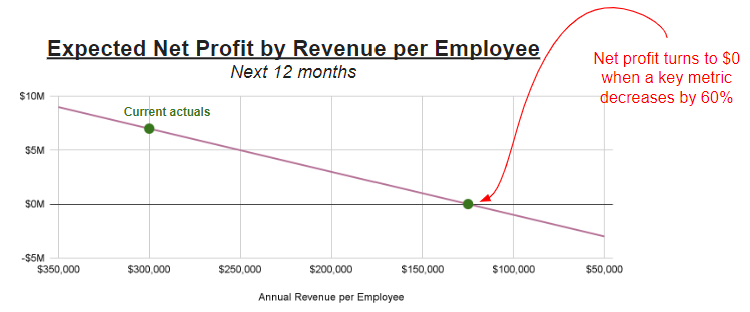
Once you've identified your key metrics and stressed them to the point of breakeven profitability, you will have a better idea of what needs to be done today to increase your resilience to external stressors. In general, you'd like to button up the business to reduce exposure to the biggest points of failure, and diversify on your key vulnerabilities.
"People think focus means saying yes to the thing you've got to focus on. But that's not what it means at all. It means saying no to the hundred other good ideas that there are. You have to pick carefully. I'm actually as proud of the things we haven't done as the things I have done. Innovation is saying no to 1,000 things."
Steve Jobs
By focusing on what your company does exceptionally well, and saying no to the other good ideas, you are able to create an extremely compelling value proposition to your customers externally, and can create an extremely efficient operation internally. Ask your best 2-3 customers why they chose to work with you. If they say "you're the most reputable marketing agency serving the manufacturing industry in the southeast," then you can get a pretty good sense on what they want you to continue focusing on-- manufacturing and the southeast. It might be a good idea to decline the temptation to expand to a different industry or geography unless you've already captured the majority of the market share in those segments of the market.
Working Capital is the amount of money you have in your cash balance today, and excludes how much you expect to get paid tomorrow from an Account. Contracts with your clients may offer a payment plan that allows the client to pay after work has been done. This constitutes your Account Receivables in accounting. This is money that you might not ever actually see, in the scenario where a client runs out of money or goes bankrupt before they can pay you back in a scenario of widespread financial distress in the economy.
Work with your CPA to do an audit of your existing contracts and your financial KPIs (key performance indicators) like Weekly Net Cash Flow and Current Ratio. Make an assessment of the impact to your own company's solvency if you had to charge off your 2-3 largest accounts.
If this scenario looks bleak, you have a few options to optimize your working capital:
At the end of the day, the most important thing is to look at the numbers and address anything that surprises you (disclaimer: you will most certainly find a few surprises, including wasteful expenses you did not approve). Work with your FP&A team to do a deep dive to find more ways to increase your working capital.
Don't put all your eggs in one basket, as the saying goes. In your business, this can be represented in a few ways:

For the first two questions, diversification is quite simple-- don't get too comfortable with a business that relies on a few good clients and a few good suppliers. Make it a priority to acquire more larger clients and negotiate multiple suppliers. When it comes to the last question, however, there is a fine balance to walk between focus and diversification.
Focusing on one product allows you to be exceptional at delivering value efficiently to customers. But it only works until it doesn't. Never forget the iconic example of Blockbuster. I remember walking the aisles with my siblings on a Friday afternoon in the early 2000's, picking out a movie and snacks for family night, and we loved it despite the price and the inconvenience. Believe it or not, the leaders at Blockbuster turned down a chance to purchase Netflix for $50 million in 2000. We all know what happens next--Netflix leaned into modern technologies while Blockbuster simply kept doing what used to work well for them, and now our family night experience is convenient, inexpensive, and ridden of late fees, and Blockbuster simply does not exist. They went from generating $6 billion annual revenue in 2004 to filing for bankruptcy 8 years later, and Netflix continued to grow to $36 billion annual revenue in 2024.
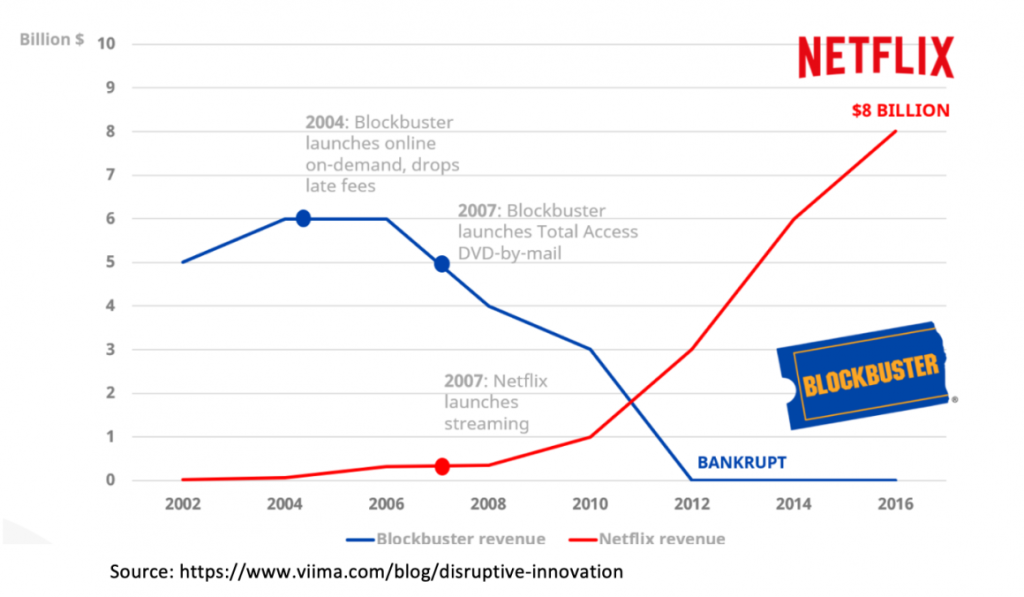
I recommend re-evaluating your business strategy every 6-12 months. Assess what is going well and genuinely listen to your customers' complaints about what they dislike about your product or service. If customers are leaving to a competitor, give them a call to understand why. Work with the team to identify how you could make your offering even better. Lean into incremental improvements that make sense to incorporate to be continue being a dominant leader in your space.
Once you have stress tested your KPIs and addressed (or created a plan to address) the biggest points of failure in your business, you now have the full context to build your playbook. Don't feel the need to do this all alone. Often times you'll receive the most value from frontline employees who have a deep understanding of the specific vulnerabilities your company is experiencing, and equipped with the right tools, they can help you solve these challenges for you.
Determine what you will stop, start and continue doing in response to a change in the economic environment, namely at the start of a contraction period as well at the start of an expansion period.
For example, at the start of a contraction period, LaunchMinds would respond by 1) stop spending on long-term investments on market research that isn't expected to generate revenue for 18 months, 2) start offering a loyalty program with discounts to existing customers, as well as expanding referral bonuses, and 3) continue focusing on its core marketing service to their specific industry and geography.
Get started with applying the TAP framework and building your business resilience playbook.
Need a jumpstart? Get access to our free template using the form below!
Go Fig was recognized as a finalist for the 2024 South Carolina InnoVision Awards for having advanced innovation and technology and making significant contributions to the state of South Carolina.