
Ever started working on a project with data in an Excel spreadsheet only to find the data is out of date? Spreadsheets are the go-to tool for Finance teams to perform analytics, financial modeling and forecasting. But data that is out of sync with the latest information is a major limitation on the value of those projects.
If you've ever worked with data in your organization, you have probably felt a similar pain. If not, it goes like this: It's Monday morning, you need updated revenue numbers for the board deck due Wednesday, but the CSV export IT sent you last week is already stale. You submit another ticket, mark it "urgent," and hope you'll get the data before your deadline.
This problem isn't just painful, its costly for both Finance and IT.
What if I told you that you could effortlessly keep the data in an Excel Live spreadsheet in sync with the latest data from your database? Yes, really. Keep reading.
The Invisible Tension Between IT and the Business
In most organizations today, there is an ongoing tension that exists between the IT team and their business counterparts. And I'm not talking about the tension where finance tries to limit IT's budget (Go Fig can help alleviate this friction as well by relieving IT bandwidth, but more on this later).
The tension I'm talking about here is the need for data from finance, and the burden these requests create for the IT team:
Finance Team:
Finance teams are completely dependent on IT to source data because they can't write SQL and don't even have database credentials. Even when business intelligence (BI) tools do allow for CSV exports, if the existing dashboard isn't exactly what is needed, they default to filing an IT ticket. BI is either too complex to use or the team simply refuses to learn it because spreadsheets are where the real value is. The result? Projects get delayed by days to weeks just waiting for turnaround on their data requests, and spreadsheets simply aren't updated nearly as often as they should be due to this friction.
IT Teams
IT teams are overly burdened in adhoc data requests. Every "quick" data request takes them away from focusing on strategic IT initiatives. A typical data engineer could spend up to 20 hours per week—literally half their time—responding to requests with varying degrees of urgency from finance, sales, and marketing. And the complex technical strategy they were hired to execute gets put on the backburner.
It's a lose-lose scenario that's costing both teams their sanity and the company's competitive edge.

Why Finance Teams Prefer Spreadsheets
I can already hear the battle cries from data folk that Finance teams should learn SQL or BI. As someone who started off in Finance and eventually did go on to learn SQL and Python in my transition to Data Science, I'm going to make this next prediction very confidently: finance professionals are not going to abandon Excel or Google Sheets anytime soon, and they shouldn't have to.
If I told you there was a data product that was fast, simple and easy to use, everybody on your team already knew how to use it, and as of last week integrates with AI, wouldn't that sound like a product you would buy for your team? Oh and btw, this product was basically free.
That's exactly what a spreadsheet is.
Spreadsheets are fast, powerful, versatile tools. To be honest, very few BI tools can compete with the spreadsheet in a footrace in the last mile of exploratory analytics.
However, the bigger problems with spreadsheets is when users do too much with them: heavy computational data retrieval, data cleaning, and pivoting across dozens of sheet tabs referencing more than 1,000,000 rows of data. Or saving multiple copies of the same spreadsheet to solve for the lack of inherent version control. These are the limitations that a data tool needs to solve for.
Introducing data workflows: no-code ETL that clean, process and aggregate data before shipping it off to a spreadsheet for slicing and dicing.
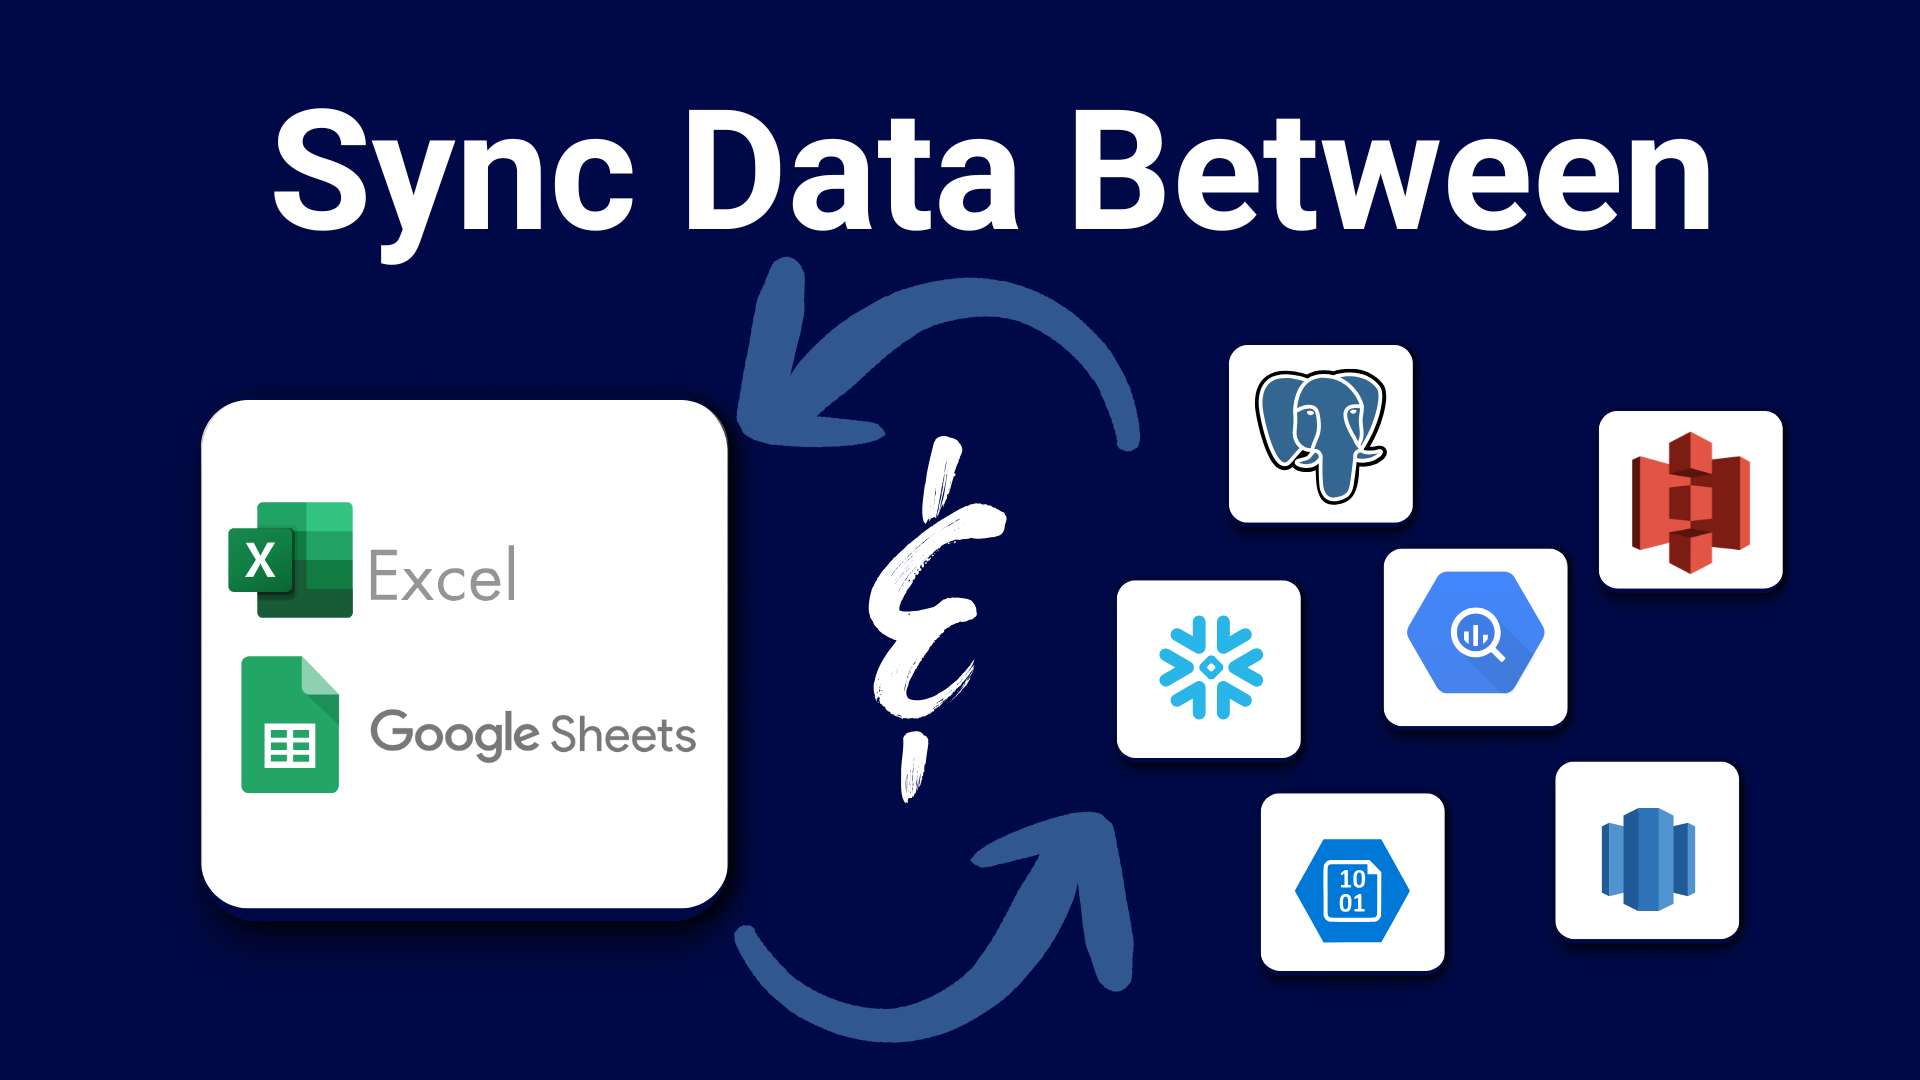
Data Workflows from SQL Database to Excel
Imagine a scenario where business stakeholders in an organizations could completely self-serve their data requests:
- Access real-time data from your database (i.e. Snowflake, BigQuery, or SQL Server)
- Combine data from multiple tables
- Transform and aggregate data using familiar spreadsheet logic
- Export data to an Excel sheet tab and set on an automated schedule to sync hourly or daily
- Make edits for follow-ups and deep dives without any IT involvement
This isn't a fantasy.
This capability already exists in the Power BI suite: UpSlide describes Power Query as the perfect solution for business users to interface with data in a low-code UI for organizations that don't have a data engineer. It does take some training, as the Power Query logic is noticeably different from standard spreadsheet logic.
Go Fig offers a simpler alternative solution to this problem with visual workflows that work with existing spreadsheet logic.
Case Studies for B2B SaaS and Fintech Companies using Go Fig
Example 1: Cost Control at a Growing SaaS Company
A Finance Director at a 200-person B2B SaaS company was working on a project to understand operating costs. Previously, they would wait multiple days for IT to pull data from their MS SQL Server into a Power BI dashboard. The Finance director would ask IT for updates on a regular basis, and access the data by downloading the Power BI tables as a CSV. This created a lot of friction in the initial model build, and very challenging to monitor costs to identify spikes in costs quickly.
With Go Fig, they've set up an automated workflow that:
- Pulls data from their SQL Server every day at 7 am
- Automatically calculates standard cost metrics for each cost category
- Flags any costs outside the expected bounds
- Updates their Excel Live Spreadsheet before they even open their laptop
Results:
- Time to setup: 15 minutes
- Estimated IT tickets eliminated: 52 per year (~1 per week)
- Estimated cost savings: $62,400 + up to $100,000 in catching cost spikes quickly
- Estimated ROI: 16,200%
Example 2: Cash Flow Forecasting at a Real Estate Startup
Leadership at a real estate startup needed to predict cash flows 6 months out to manage their burn rate. They were manually downloading real estate market data from Redfin and combining it with internal sales data—a process that took 8 hours every month.
With Go Fig, their new workflow is completely automated and provides insights more frequently:
- Connects directly to Redfin's S3 bucket to access public real estate market data
- Joins it with internal sales data in BigQuery
- Runs predictive models for 6-month cash flow projections
- Delivers updated forecasts to Google Sheets weekly (instead of monthly)
Results:
- Time to setup: 30 minutes
- Estimated time saved: 96 hours
- Estimated cost savings: $19,200
- Estimated ROI: 740%
The CFO now has real-time visibility into cash position, and the analyst who used to spend a full day per month on this now focuses on strategic analysis instead of data wrangling.
How No-Code Workflows Bridge the Gap
The breakthrough comes from no-code workflow builders that speaks the language of the business, not IT's. Instead of writing SQL queries like:
SELECT customer_id, SUM(revenue) as total_revenue
FROM transactions
WHERE date >= '2024-01-01'
GROUP BY customer_id
Finance teams use familiar spreadsheet logic:
- Select your data source (like choosing a worksheet)
- Filter by date (like using Excel's filter function)
- Group and sum (like creating a pivot table)
- Schedule refreshes (like setting a calendar reminder)
Even better, with AI assistants like Fig AI, you can simply describe what you need in natural language. For example: "Pull last month's revenue by customer and update my forecast model every Monday at 8am."
Getting Started Is Easier Than You Think
If you're still manually updating spreadsheets or waiting on IT for data refreshes, you're not alone. Most finance teams are stuck in this pattern because they don't have the right data tooling. But the technology exists today to connect your spreadsheets directly to your data stack—no SQL required, no IT bottleneck, no more stale data.
The companies that figure this out first will not only experience cost savings, but also increase the engagement of their teams by enabling them to make use of their data to add more value to the organization. And they'll be less likely to leave for a less tech-enabled organization.
Why IT Teams Should Champion This Change
If you are an IT leader and you've read this far, you care deeply about enabling your partner teams with the right data tooling. Kudos to you. If you're still on the fence, here's a message I want to reinforce: enabling finance and business teams to self-serve their data needs isn't giving up control. It is strategic delegation. When you implement a no-code workflow solution, both you and your partner teams benefit:
- You maintain governance and security over data access
- You reduce your ticket queue by 80%+
- You free up 20+ hours per week for strategic IT projects
- You become a hero to the business teams rather than a bottleneck
The most forward-thinking IT teams are actively implementing data tooling that better supports business teams because they are starting to recognize that BI tools are failing to meet the business where they need support in regards to adhoc data requests. And freeing up these resources equally benefits IT with more time and focus to build robust, scalable infrastructure that further enables the entire organization. This is a true win-win outcome.
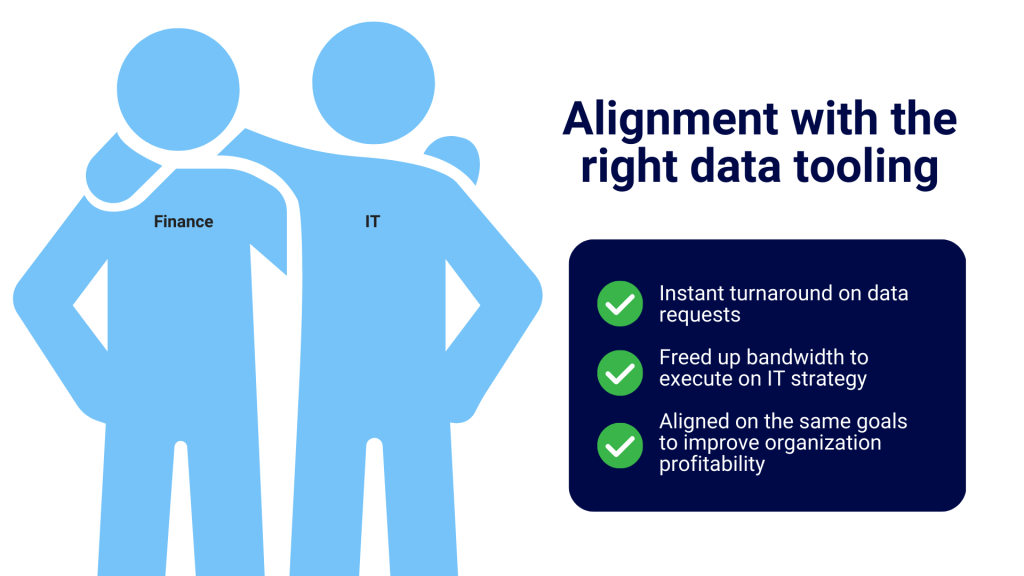
Table of Contents
Excellent breakdown, I completely agree with the challenges you described. For our projects we started using Go Fig to build our data workflows, and it has simplified the entire process. It’s refreshing to see technology finally making analytics smarter, not just faster.
I must say this article is extremely well written, insightful, and packed with valuable knowledge that shows the author’s deep expertise on the subject, and I truly appreciate the time and effort that has gone into creating such high-quality content because it is not only helpful but also inspiring for readers like me who are always looking for trustworthy resources online. Keep up the good work and write more. i am a follower.