
Go Fig vs. Anaplan
Software ToolAnaplan is a powerful enterprise planning destination, built for Fortune 500 companies with dedicated modeling teams. Go Fig connects and reconciles a mid-market finance team's systems and loads fresh data into the Excel they already use, with Celeste, an AI analyst, running segmentation and reporting on top. Live in weeks, at a fraction of the cost.

Anaplan
- 6 to 18 month implementation timeline
- Requires dedicated Anaplan builders or expensive consultants
- $250K+ annual cost puts it out of reach for mid-market
- Steep learning curve with a proprietary formula language
- Over-engineered for companies under 1,000 employees
Go Fig
- Live in under 30 days versus 6 to 18 months
- White-glove implementation, no internal resources required
- Mid-market pricing, a fraction of Anaplan's cost
- Celeste delivers the analysis in Excel, Slack, and where your team already sits
- Built for the finance practitioner who needs reconciled numbers, not another model to configure
The Comparison at a Glance
| Capability | Anaplan | Go Fig |
|---|---|---|
| Target market | Enterprise (1,000+ employees) | Mid-market (50-500 employees) |
| Implementation | 6-18 months | < 30 days |
| Annual cost | $250K+ | $24-60K |
| Implementation approach | Self-build or hire consultants | White-glove, we build it for you |
| Formula language | Proprietary (Anaplan-specific) | Familiar Excel-like syntax |
| Cross-functional planning | Yes, with significant setup | Yes, out of the box |
What Anaplan Does Well
Anaplan is one of the most powerful planning platforms in the market:
- Enterprise scale: Handles complex planning for organizations with thousands of employees
- Connected planning: Links financial, supply chain, and workforce planning
- Modeling flexibility: Build virtually any planning model with enough expertise
- Established ecosystem: Large partner network for implementation support
For Fortune 500 companies with dedicated planning teams and $250K+ budgets, Anaplan is a proven choice.
Why Mid-Market Finance Teams Choose Go Fig
1. Connected Data in Excel, Not a New Destination
Anaplan is a platform you log into to build models. Go Fig connects and reconciles the systems your finance team already runs, then loads fresh data into the Excel they already use. Celeste runs segmentation, reconciliation, and reporting, and the output shows up in Excel or Slack. You don’t train your team on a new tool. The work shows up where they already work.
2. Weeks, Not Quarters
Anaplan implementations typically take 6 to 18 months and require Anaplan-certified builders or consultants at $200 to $400 per hour. Go Fig’s team connects your systems and reconciles your data in under 30 days. Connections, segmentation, and live reporting are running before Anaplan would finish scoping.
3. Mid-Market Pricing
Anaplan is built for enterprise budgets. Most mid-market companies on Go Fig pay a fraction of that, with faster time to value and a Free P&L Audit to prove it before you commit.
4. Built for the Numbers You Have to Defend
Anaplan is exceptional at modeling once the model is built. Go Fig is built for the finance practitioner who needs to know, today, what’s actually driving margin, with every number tracing back to the source transaction so it holds up when it reaches the board. Reconciled, traceable data, not model configuration.
5. Right-Sized for Your Team
Anaplan’s complexity makes sense for a 5,000-person organization with dedicated planners. For a 200-person company, that complexity becomes overhead. Go Fig is purpose-built for the mid-market, governed enough for audit, light enough that finance doesn’t need a new headcount to run it.
When Anaplan Makes Sense
Consider Anaplan if you:
- Have 1,000+ employees with dedicated planning resources
- Need to model complex supply chains or multi-geography workforce planning
- Have budget for $250K+ annually plus implementation consultants
- Can wait 6-18 months for full deployment
When Go Fig Makes Sense
Consider Go Fig if you:
- Are a finance practitioner at a 50 to 500 person company who needs reconciled, current numbers now
- Need margin diagnosis and reconciled reporting in the Excel you already use, not another tool to learn
- Want to be live in weeks, not quarters
- Want Celeste doing the data work inside Excel, Slack, or wherever your team already sits
- Need your systems connected and reconciled into one governed, traceable model, not another destination to log into
The Bottom Line
Anaplan is a Ferrari. Incredible performance, expensive to buy, expensive to maintain, and overkill for most roads. Go Fig is built for the mid-market finance team. Fast to deploy, governed by default, and focused on getting reconciled, traceable data into the Excel your team already uses.
Every team plans. Every plan connects.
Drive aligned, data-informed decisions with unified inputs from sales, marketing, and operations.
Sales Forecasts
Track CRM deals, ARR, win rates, and contract value, all tied to revenue goals. Sales owns their forecast, and finance sees the impact on cash flow and runway in real time.
- Pipeline value and stage conversion rates
- ARR and bookings forecast by rep and region
- Churn and renewal projections
- Closed/won tied directly to revenue recognition
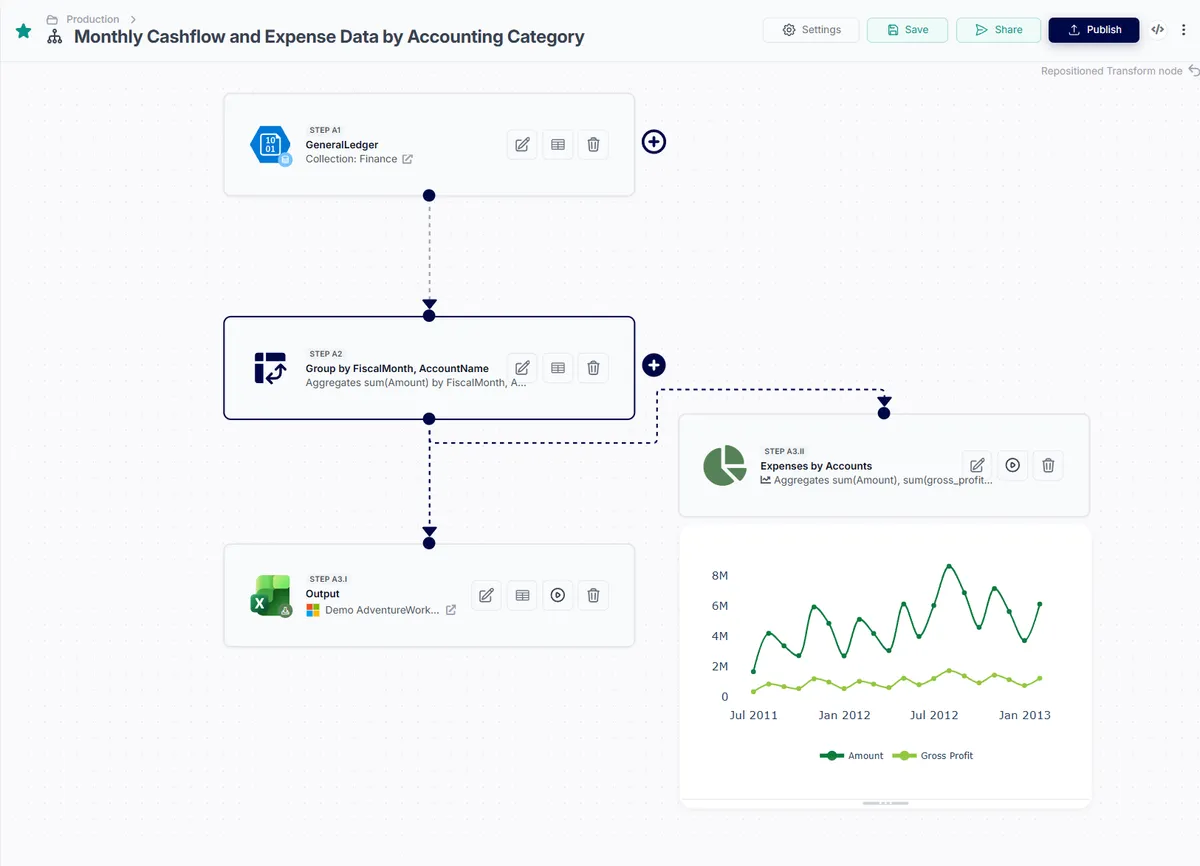
Marketing Spend & Performance
Track spend by channel and campaign, align on ROI, and adjust plans as performance evolves. Marketing plans their budget, and the financial model shows the impact on CAC and pipeline.
- Budget vs. actuals by channel and campaign
- Customer acquisition cost (CAC) in real time
- ROI by channel with historical benchmarks
- Pipeline contribution tied to marketing spend
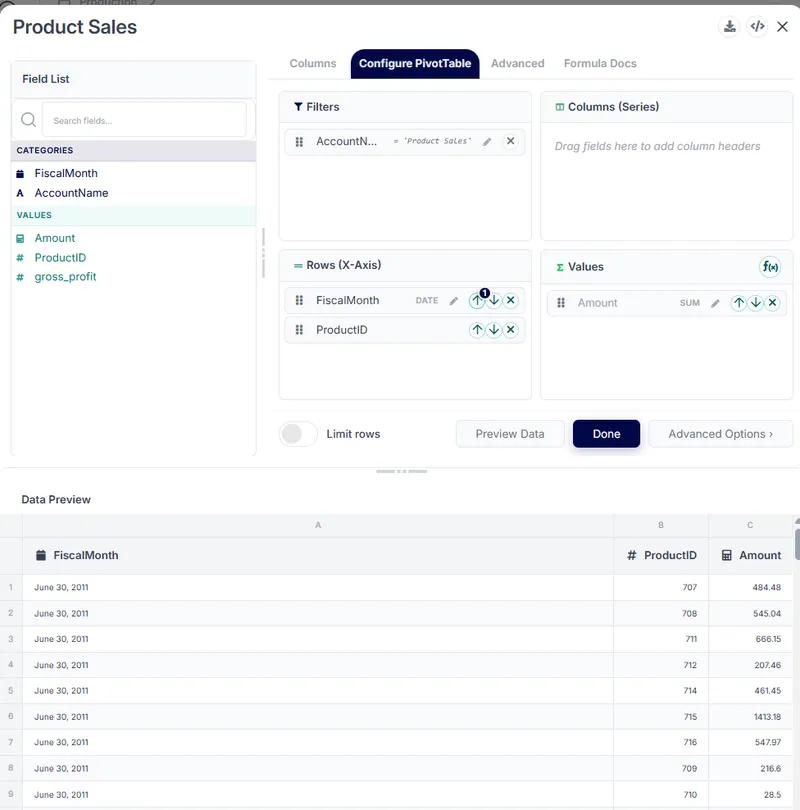
Headcount Plans
Plan roles, start dates, and compensation across teams while staying within budget. See how every hire affects burn rate, runway, and department budgets before you post the job.
- Team headcount by department and role
- Start dates with ramp assumptions
- Fully loaded compensation (salary + benefits + equipment)
- Variance vs. approved headcount plan
What your new financial reporting toolkit could look like
Everything your team needs to plan, forecast, and make decisions in one connected platform.
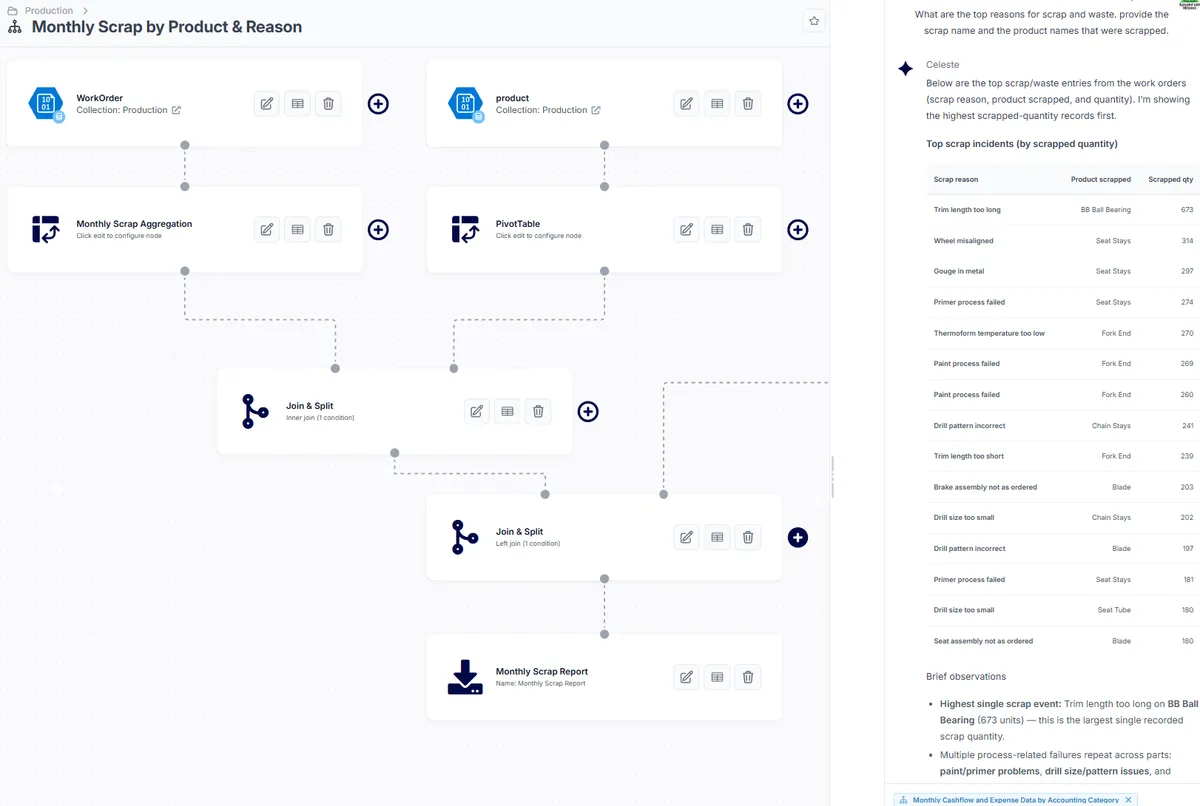
AI Analysis AI
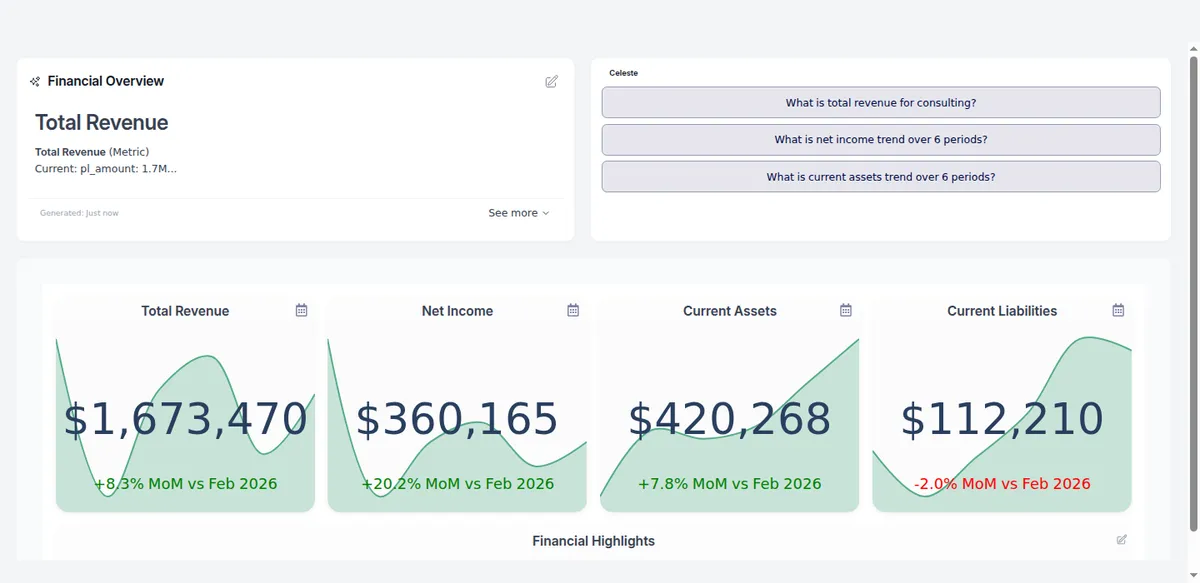
Celeste explains variances and generates board-ready summaries with audit trails.
Anomaly Alerts
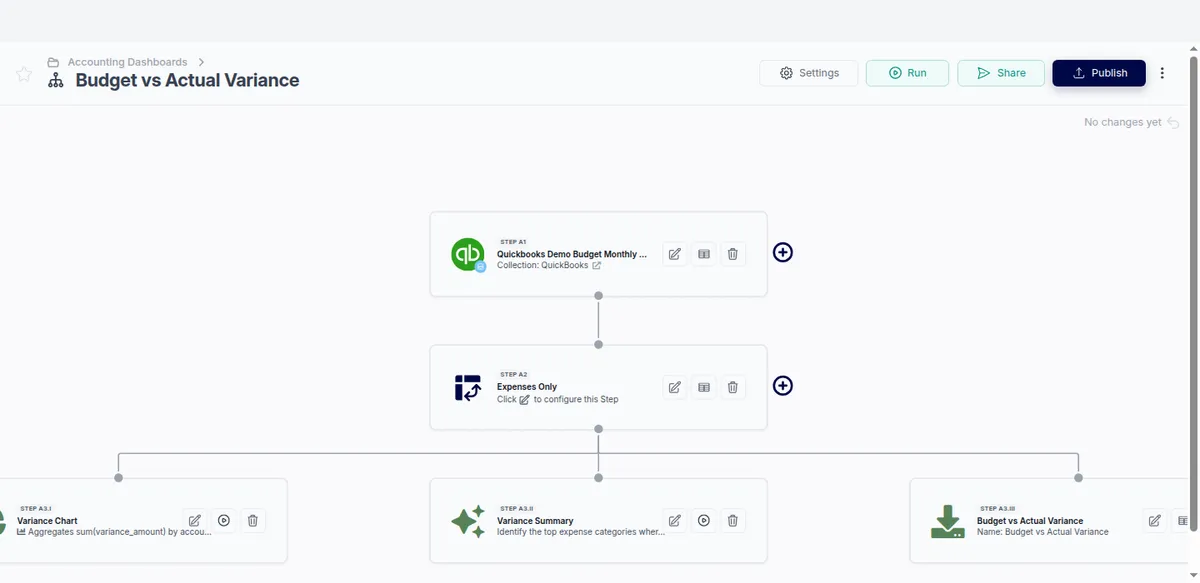
Get notified the moment a metric breaks pattern. Spot variances before they show up at close.
Real-Time Reporting
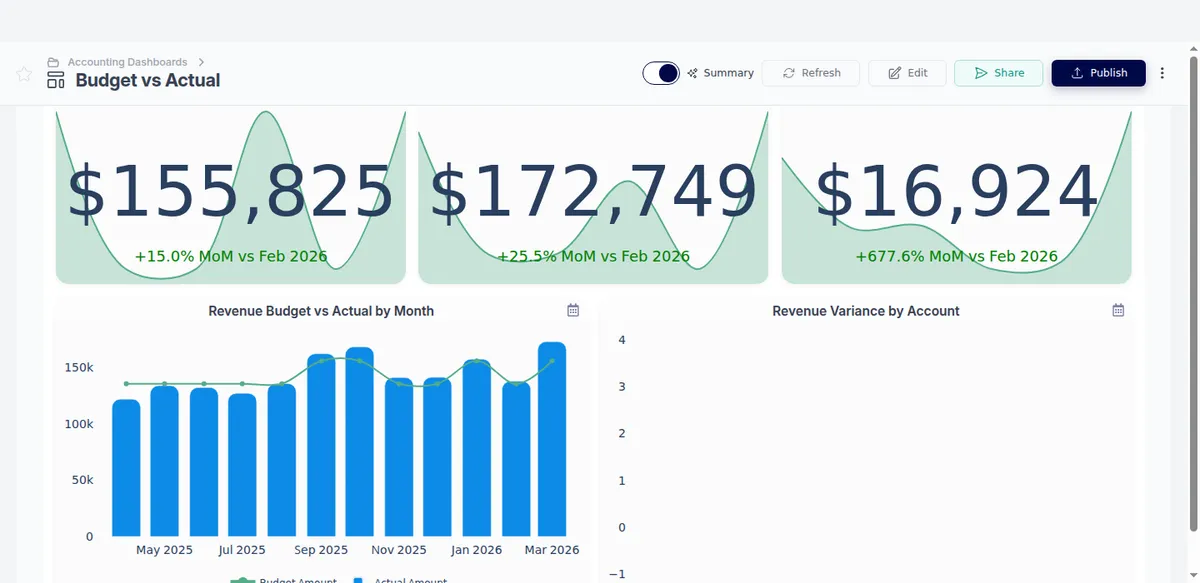
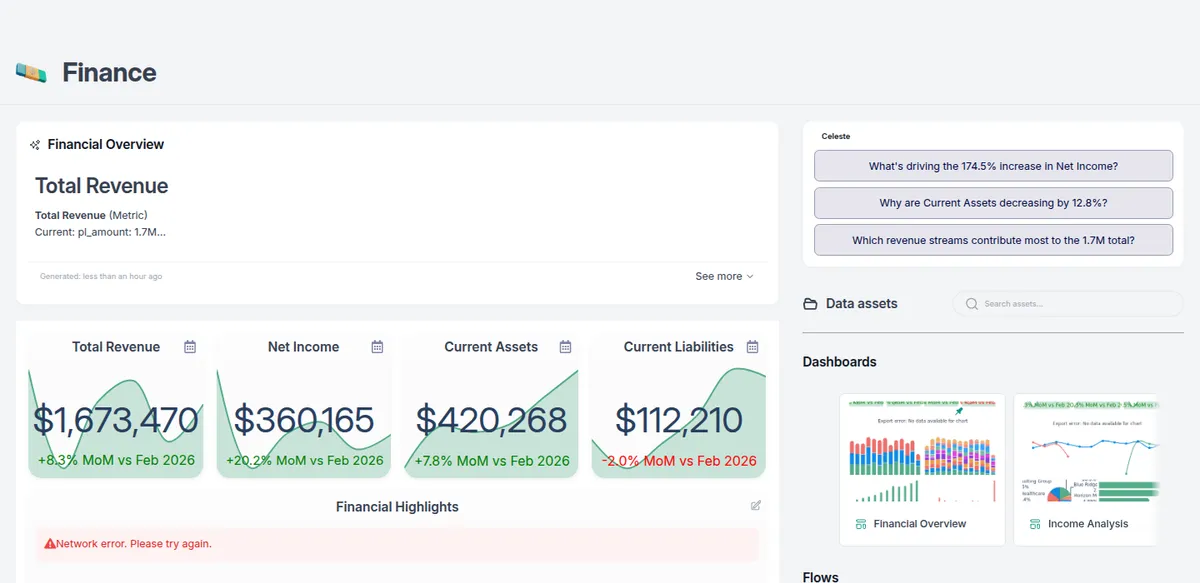
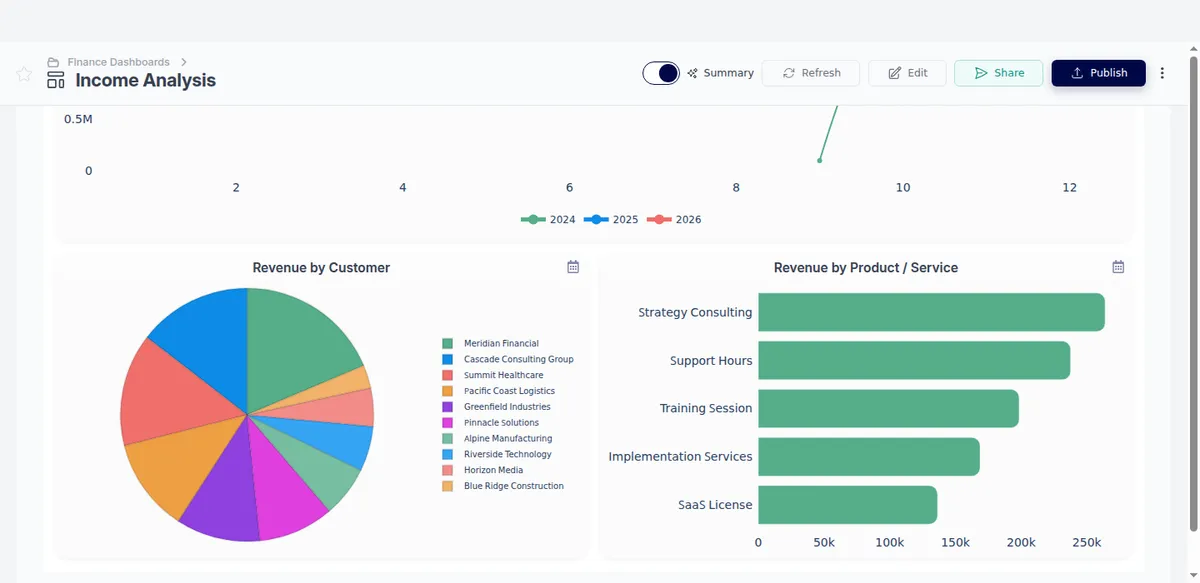
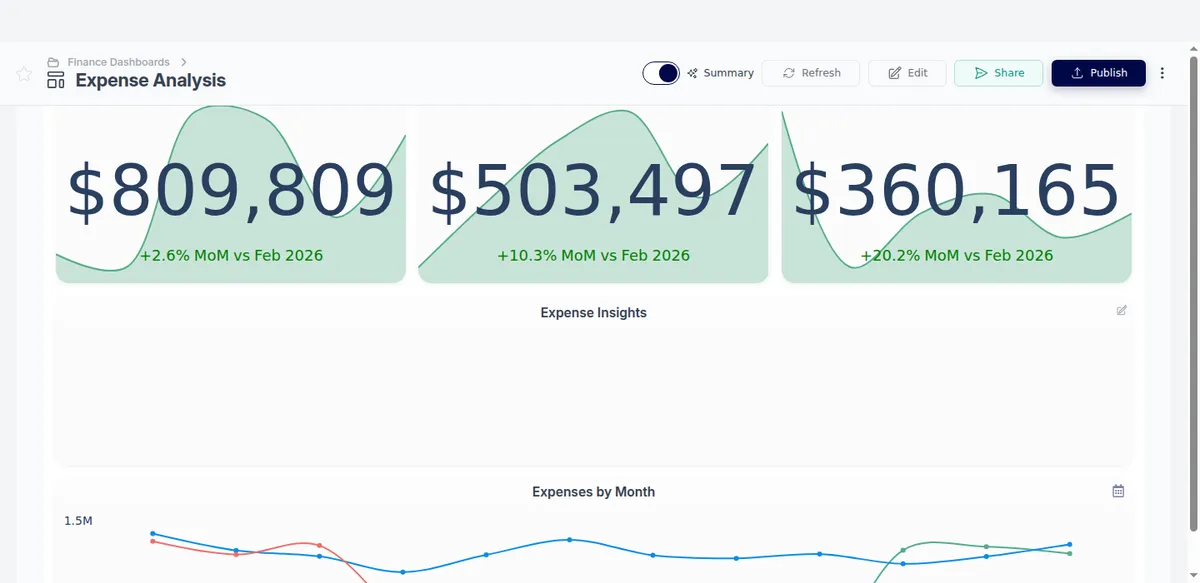
Live financial dashboards that update as your data changes. Drill into any number to its source system.
Excel Sync
Bi-directional sync keeps your existing Excel models powered by live data.
Unlimited Data Analytics from Excel MCP
No more downloading CSVs from PowerBI or waiting on a data analyst to write SQL. Pull any metric, any cut, any period directly into Excel via the Go Fig MCP.
Write-back to Accounting from Excel MCP
Push journal entries, classifications, and adjustments back to QuickBooks or NetSuite directly from Excel.
Cross-Functional Collaboration
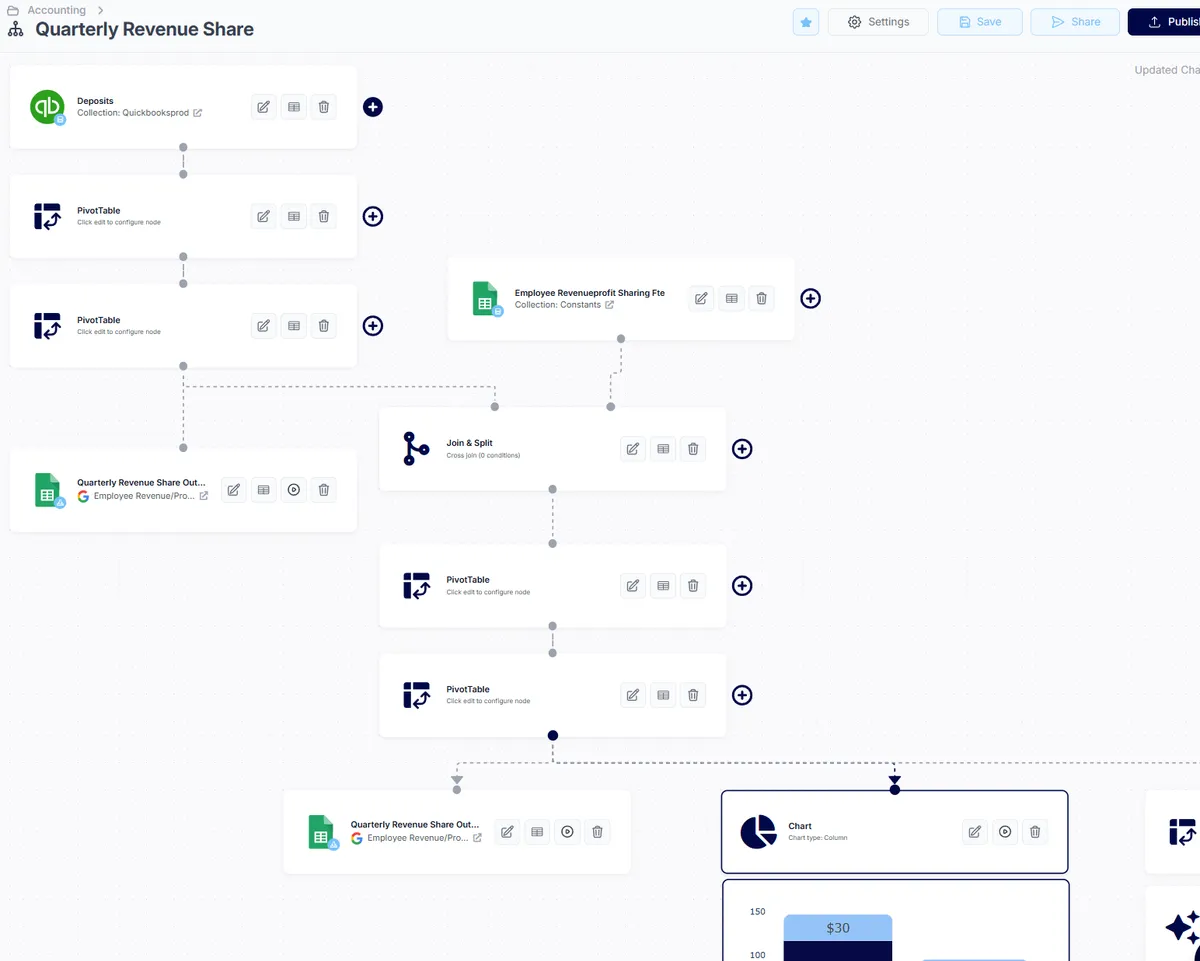
One source of truth across Finance, Sales, and Ops. Plans, actuals, and assumptions stay aligned without merging spreadsheets.
Multi-Entity Consolidation
Consolidate across subsidiaries with currency conversion and intercompany eliminations.
Data Governance & Access Controls
Role-based access, full audit trails, SSO, and MFA. SOC 2 Type II certified.


100+ Integrations
Connect ERPs, CRMs, HRIS, and databases. Need a custom connector? We build it.


How It Works
Watch a 2-minute walkthrough from our founder.
Month-End Systems
Systems that handle recurring close tasks: reconciliation, consolidation, and report delivery on schedule.
How a Go Fig rollout runs
Week 1: Discovery
A solutions engineer learns your business, connects your systems, and maps where the work actually piles up. You keep working while we do the heavy lifting.
Weeks 2-3: Capture & build
We pull your systems into one governed data layer you own, then build the agents and reporting your team needs on top of it. No data engineers or technical skills required on your end.
Week 4: Launch
Your team goes live. We train everyone, validate against your actuals, and make sure every number ties out. Your first agent is in production.
Ongoing: We stay
We tune the agents against what your team approves, build the next one, and stay on as the system grows. You are never handed a login and left alone.
Explore Other Comparisons
Ready to See Go Fig in Action?
Get a personalized demo showing how Go Fig compares to your current approach.
Request a Demo